UPFINA's Mission: The pursuit of truth in finance and economics to form an unbiased view of current events in order to understand human action, its causes and effects. Read about us and our mission here.
Reading Time: 5 minutes
Whether you’re bullish or bearish, you need to be cognizant of where you might be wrong. In the bear case, the risks would be to the upside. Since practically everyone in the mainstream is convinced that nothing can go wrong, we’ll review the risks to the downside.
The biggest risk to equities in the long run is valuations. Looking at the market cap of the US stock market in relation to US GDP isn’t a great metric because of the vacillations in the amount of corporate profits which come from abroad. The chart below does a better job as it measures the world market cap compared to the global GDP. There are valid reasons for why the valuation is so high, but that doesn’t justify the sustainability of these levels. The top reasons are low interest rates, large buybacks, and large capital flows coming from baby boomers looking to invest their nest egg before retirement. These catalysts won’t remain in place forever.
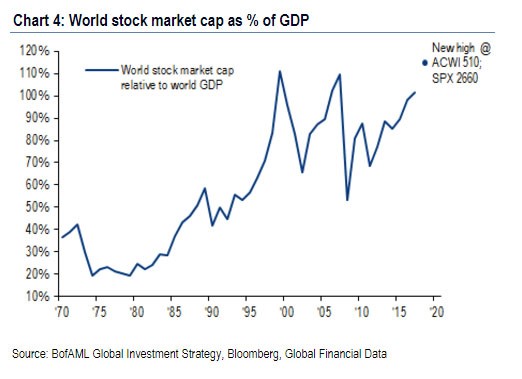
World Stock Market As Percentage Of World GDP Is Nearing The Previous Two Peaks
The market cap as a percentage of the GDP is just below the peaks from 2000 and 2007. If the ACWI (All Country World Index) reaches 510 or the SPX reaches 2660, the ratio will reach a record high. The world index would need to rally 7.15% to reach that mark and the S&P 500 would need to rise 7.58% to reach that level. This means the valuation of the global stock market could reach a record high in the next few months. It’s often discussed how the US equity market is expensive, but clearly other markets have valuations higher than their average.
As expected, with such expensive stock valuations the cash as a percentage of assets under management is down to the lowest point since at least 2005. Not holding cash makes sense in today’s low interest rate environment. Even with low inflation, if you hold your money in a near 0% interest bearing savings account, then your spending power will diminish over time. As a reminder, the fact that there is an explanation for this allocation, doesn’t mean it’s sustainable. The obvious change which can take place is interest rates rising. This would cause stocks to have lower valuations as CDs would be more competitive. The other reason is demographics. Baby boomers are approaching retirement age and with the current IRS rules they will be forced to begin withdrawing capital from their IRA accounts after hitting 70.5 years of age. That would be a negative catalyst on bonds and equities, as it increases the number of sellers. In the short term, this cash percentage might diminish further and push stocks higher until there’s a negative economic catalyst.
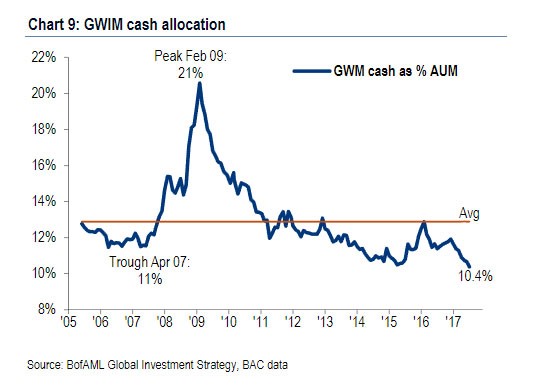
Cash Allocation Is The Lowest Since At Least 2005
The two asset classes which are benefiting from low interest rates are stocks and risky debt. The chart below shows the leveraged loan market. It exploded higher in the first half of 2017. It’s on pace to break the 2007 level of new-loan volume. 70% of the loans in America and Europe are cov-lite. These cov-lite loans don’t have the normal debt covenants, which are restrictions on borrowing, giving them higher yields.

Newly Issued Leverage Loan Volume
Some cov-lite loans lack debt incurrences and restricted payments covenants. A debt incurrence is a legal restriction that prohibits debt to be issued at the same seniority level if certain financial ratios aren’t met (such as a certain debt to equity ratio). It’s a disaster waiting to happen if you invest in a high yield bond which doesn’t have to meet normal financial ratio requirements. A restricted payments covenant is a limit to the dividends, distributions, certain investments, and certain repurchases of junior debt and stock to make sure the company has enough money to pay back their bonds. Obviously, not having this restriction means reckless behavior can occur. A business which is about to go bankrupt could decide to pay dividends which could help stockholders at the expense of senior bondholders (the cov-lite bondholders).
As you can see from the chart below, the bondholders probably should be worrying about the information they aren’t getting from the businesses they are lending money to because the high yield gross leverage is higher than the peak after the financial crisis and after the tech bubble burst. The leverage usually picks up after a recession is ending because that’s when earnings decline. The earnings decline hasn’t even happened yet as the mini earnings recession ended in Q1 2016. That is a bad sign for how high leverage will get in the next recession.
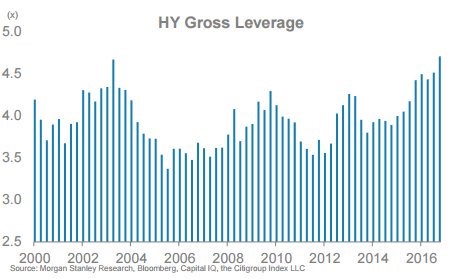
High Yield Gross Leverage Volume Is Higher Than The Previous Two Peaks
The corporations aren’t alone in the leverage they have incurred due to low interest rates. The chart below shows the latest delinquencies of auto loans. They are now at the highest point since the financial crisis. The auto loan debt bubble is $1.2 trillion as lending standards were lowered to improve sales. The rate of deliquences bottomed in Q3 2014 and has been marching higher despite the strong labor market. The question is how bad this will get when the labor market weakens. Usually default rates don’t spike if the borrower still has a job. This spike shows how low quality the loans are.
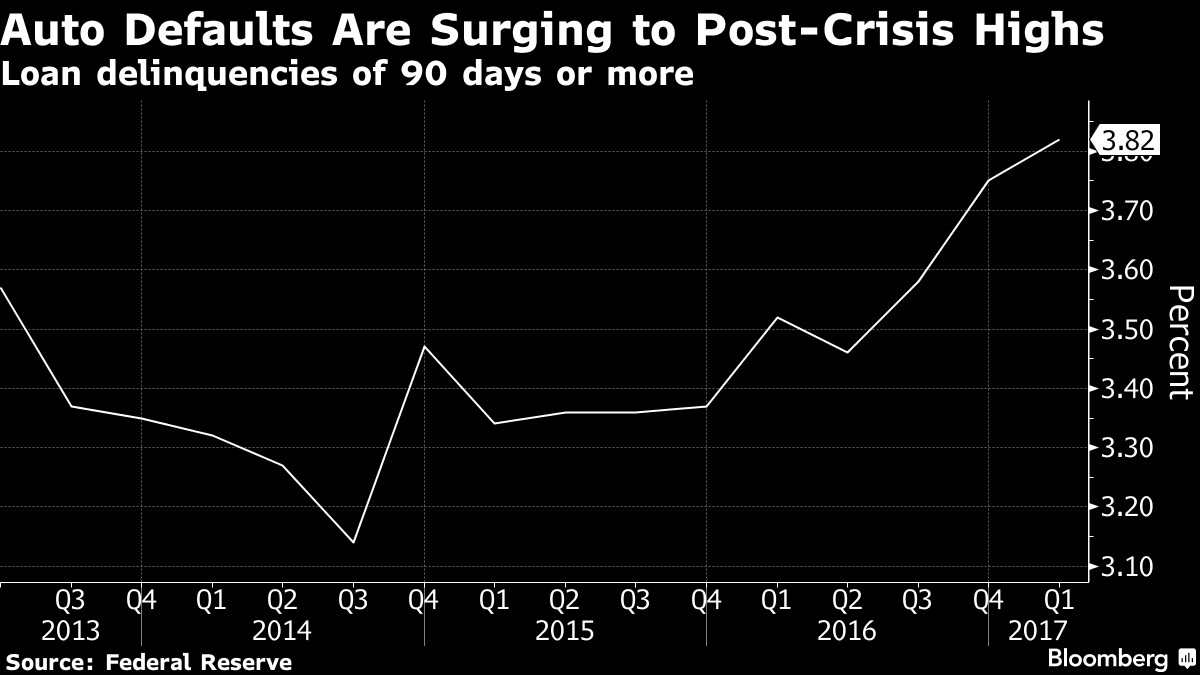
Auto Loan Delinquencies Are Rising
It’s not fair to compare this debt bubble to the housing crisis because it is smaller and because cars are expected to fall in value when they are driven out of the lot unlike houses which were expected to always appreciate. One similarity they do have is that if there’s a large wave of defaults on car loans, the inventory will build up and lower their prices just like with the housing market where defaults caused declining prices. A large wave of defaulted on cars would cause an increase in inventory, negatively impacting the price of the used car market. The used car market is already going to get an influx in inventory because of the record number of expiring leases. This will cause future lease payments to rise for new leases as sellers will be forced to recognized the lower resale value.
Conclusion
Stocks are expensive according to most valuation metrics. For example, the Shiller PE is around 30 which is about 2 points lower than the 1929 stock market bubble. This implies low future returns. The leveraged loan market shows how the market has expanded because of demand for risky bonds. It also shows how the next recession may be prolonged until all the excess debt is removed from the marketplace. Finally, it’s worth keeping in mind that the auto loan bubble is starting to burst without weakness in the labor market. It might act as a catalyst for the next recession.
Have comments? Join the conversation on Twitter.
Disclaimer: The content on this site is for general informational and entertainment purposes only and should not be construed as financial advice. You agree that any decision you make will be based upon an independent investigation by a certified professional. Please read full disclaimer and privacy policy before reading any of our content.


