UPFINA's Mission: The pursuit of truth in finance and economics to form an unbiased view of current events in order to understand human action, its causes and effects. Read about us and our mission here.
Reading Time: 5 minutes
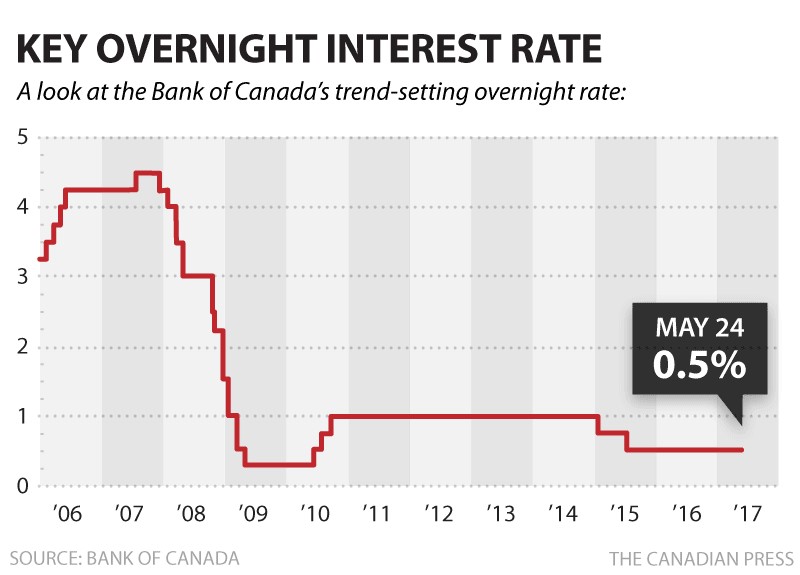
The Canadian economy was impacted by the crash in oil prices in 2014 and 2015. Canadian oil sands have a high break even cost which means oil prices per barrel must be above $60, according to some estimates, for the firms to make a profit. As you can see in the chart below, this caused the Canadian Central Bank to cut interest rates in 2015 from 1.0% to 0.5%. In July the central bank raised rates for the first time in 7 years to 0.75%. Despite this recent move this seems like an extreme measure to maintain because, while the unemployment rate initially increased from 6.6% to 7.3%, since then it fell to 6.3% (as of April 2017). The neutral interest rate is about 3% which means the current policy is highly stimulative. While the Canadian Central Bank claims the inflation rate is low, it is ignoring the bubble in housing. The U.S. Federal Reserve’s argument to keep rates relatively low in 2017 makes more sense because a bubble in stock valuations doesn’t increase living expenses directly. Housing price inflation hurts the Canadian consumer which is who the central bank wants to protect.
Before we get into the housing bubble created by the Canadian Central bank and the government which backs mortgages, let’s look at the Canadian economy. As you can see from the chart below, the leverage in the Canadian economy is enormous. There was no deleveraging during the global financial crisis as the Canadian banks weathered the storm. The credit to the private non-financial sector as a percent of GDP is the highest out of the ten economies listed below.
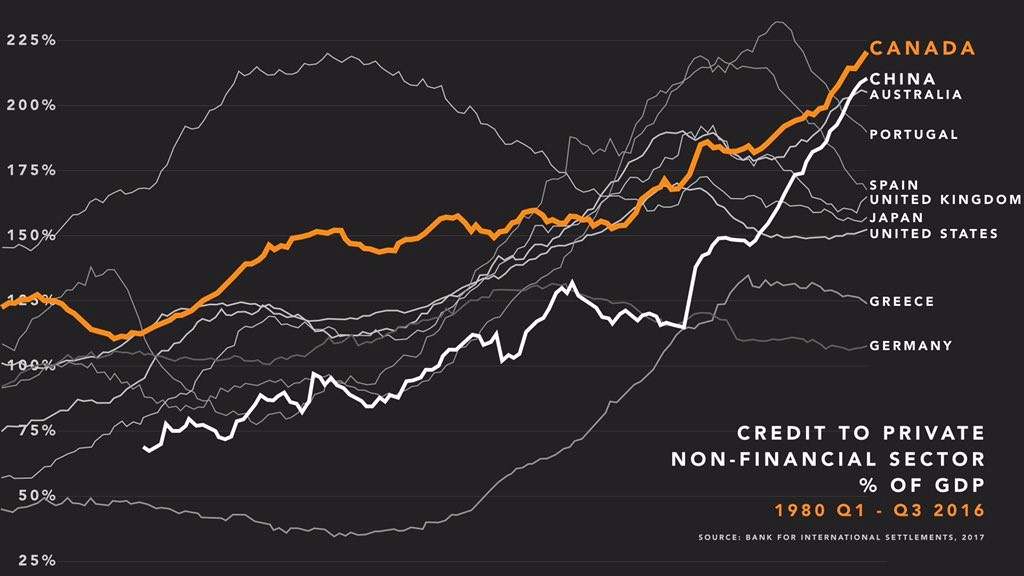
If you look closely at the chart, you can see the leverage in the American economy only got to near 175% during its housing bubble. Canadian leverage is near the peak Japan had in the 1990s. On this basis, the Canadian Central Bank should raise rates. It’s debatable whether central banks should attempt to squash bubbles, but in this case the Canadian Central Bank should, at least, stop adding fuel to the fire.
The price of Vancouver real estate is shown in the chart below.
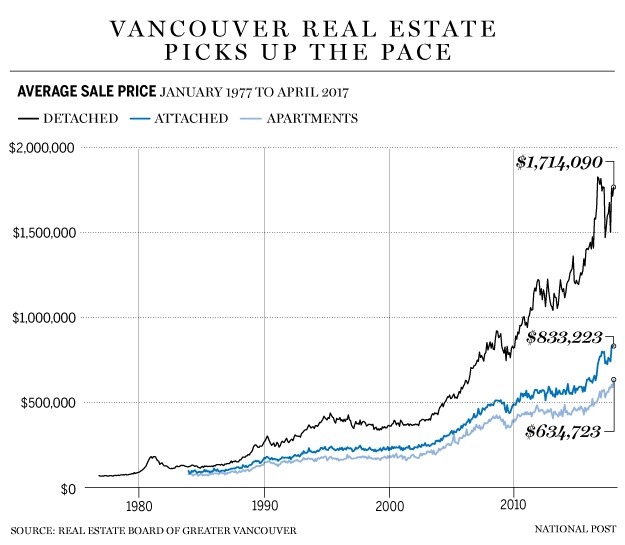
Detached home prices have risen by about 70% in the past 6 years. All parabolic charts look like the one below. Households earning the median income would need to save for 36 years to buy a detached house at these prices. To try to squash the housing bubble, the government issued a 15% tax on foreign buyers in Vancouver and Ontario in 2016 which is why you see the dip in the chart. That only slowed the average price appreciation temporarily as speculators readily bought the dip.
The sales in April 2017 fell 25.7% on a year over year basis. While that is concerning, there is basis for support, for now. The sales to active listing measures the pent-up demand for houses. When the ratio is above 20% it’s a sellers’ market. The sales to active listing ratio for detached homes is 26%, for town houses 58.2%, and 82.2% for condos. Usually declines in sales occur at peaks because most buyers can’t afford such high prices. As with stocks, when the market is illiquid, prices can fall quickly. The high prices are due to speculators who are using cheap debt to try to buy a house hoping to flip it. Flipping houses quickly was very popular in the U.S. housing bubble.
Some argue that the Canadian housing market bubble isn’t as bad as the American housing bubble because the banks don’t have high amounts of mortgage backed securities on their balance sheets and consumers haven’t been using their equity as a line of credit. However, in other aspects it’s worse because the government backs loans and homeowners can’t legally walk away from their potentially underwater mortgages. This is like the American student loan crisis which have loans that are backed by the government and difficult to default on. While some would argue that governments help prevent crises, that’s not true. Governments prevent free markets from working properly. Without government involvement there would be some near-term pain, but the economy would heal much quicker.
The chart below provides a direct comparison between the American housing bubble and the Canadian one. The chart shows the amount of money mortgage brokers are making as a percentage of GDP. It compares the costs to the long-term average. As you can see, the standard deviation from the long-term average reached about 3 in Q3 2005 and is at the same point in the current Canadian housing bubble. Mortgage brokers make more money in these markets because the number of transactions increases and the prices increases (they make a percent of the deal).

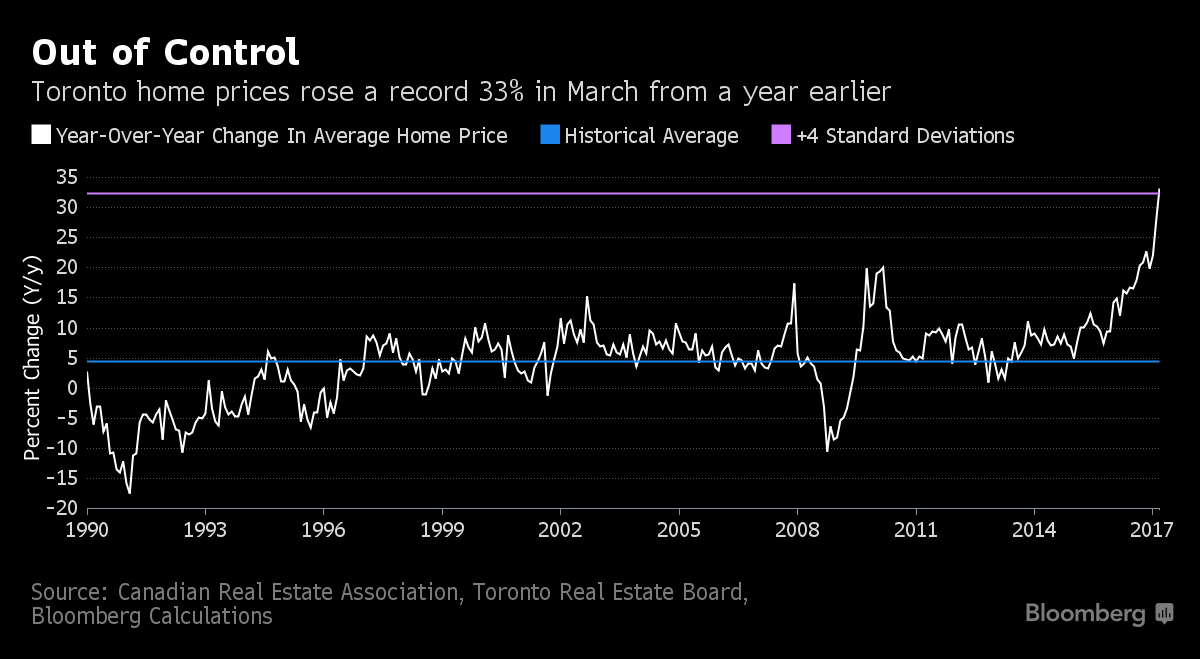
As you can see from the chart below, Toronto isn’t much different from Vancouver as housing prices increased 33% from March 2016 to March 2017. This standard deviation is about 4.0 making it larger than the one showing the profits mortgage brokers are making. During the U.S. housing bubble, there would be examples of people who made only a little more than the median income who were buying second and third houses to rent out or flip. It’s always a bad sign to see people begin speculating in a profession that they are not educated nor trained in and is out of their expertise. In Toronto, one eighth of the houses sold in the past year went to buyers who already owned property. When housing prices rise more than median income, you know it’s speculators buying because the population grows at a steady rate. There is never a sudden burst in household formation which justifies such large price increases in houses.
Some wonder when the Canadian housing bubble will collapse. There’s arguments that a catalyst is needed to spur a downturn. In America, Alan Greenspan raised the Fed Funds rate which hurt homeowners who had adjustable rate mortgages. Either a continued hike in interest rates or a slowdown in the economy could decelerate the rate at which prices are increasing, thereby changing momentum to the downside. However, prices may fall on their own because when they get to a certain point, demand dries up. When prices stop rising, sellers try to cash out and the house of cards falls.
Conclusion
The Canadian housing bubble is like most bubbles in this era. It is being boosted by the government and low interest rates. It doesn’t reflect real demand as speculators are bidding prices higher in the hopes of selling for a profit. The unwind will be painful for Canada. The central bank will be in a bind because interest rates are already near zero, so they can’t cut them. It could explain why the Bank of Canada raised rates in July, similar to what the Federal Reserve has been doing, in an effort to raise rates to have the opportunity to lower them once again in the future.
Have comments? Join the conversation on Twitter.
Disclaimer: The content on this site is for general informational and entertainment purposes only and should not be construed as financial advice. You agree that any decision you make will be based upon an independent investigation by a certified professional. Please read full disclaimer and privacy policy before reading any of our content.


