UPFINA's Mission: The pursuit of truth in finance and economics to form an unbiased view of current events in order to understand human action, its causes and effects. Read about us and our mission here.
Reading Time: 5 minutes
Weak Consumption Growth Due To Savings Increase
Heading into the Personal Income and Outlays report, GDP growth estimates of above 4% were common. After the report, growth estimates were lowered because consumer spending missed expectations. After real consumer spending growth was only 0.9% in Q1, economists were looking for a big rebound to drive GDP growth higher than the 2% growth rate seen in Q1. Optimism has been mitigated as April’s month over month consumer spending growth decreased by 0.1% to 0.5% and May’s growth was 0.2% month over month which missed the consensus for 0.4% growth. The Atlanta Fed Nowcast GDP growth estimate fell from 4.5% to 3.8% (it’s now at 4.1%) on this news because the estimate for real personal consumption expenditures growth fell from 3.7% to 2.7%.
Looking at the specifics of the report, service spending was only up 0.1%. Non-durables spending was up 0.6% because of high energy prices. Durable goods spending growth was just 0.1%. Consumers are increasing their spending on energy quicker than they are on goods and services. The good news is May personal income growth was 0.4% month over month which met expectations. The chart below, which uses BEA data, shows disposable income growth is catching up to spending growth. This is after income growth fell from 2015 to 2017 while consumer spending growth stagnated. With higher income growth and lower spending growth, the money went to savings. The personal savings rate increased from 3.0% to 3.2%.
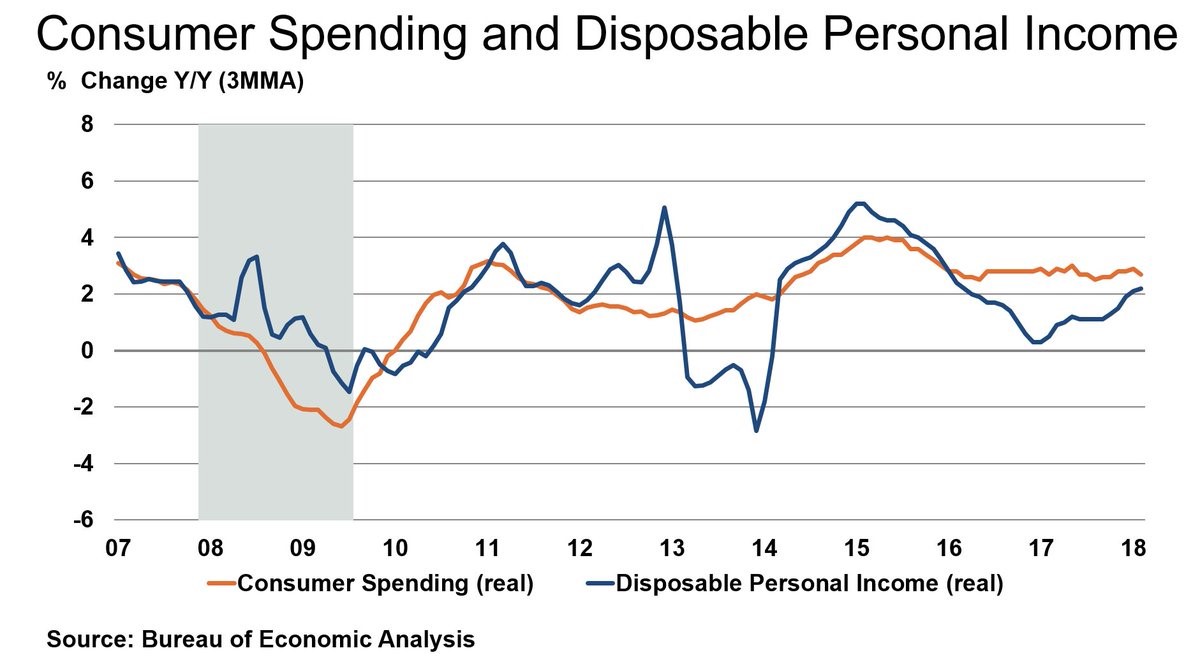
Source: BEA
There are several common ways of thinking about the personal savings rate. You would think that if the savings rate is increasing and people have more wealth, then that’s a good thing for the economy, right? However bullish investors want the savings rate to fall because it signals that the consumer is optimistic and spending. However, if the savings rate falls too low, it signals the business cycle is near its end because the consumer is over-leveraged. When the savings rate increases, it’s a sign of a recession. Sadly, on average, when there is incredible optimism surrounding the economy and growth, that is often the best time to increase saving, ahead of a downturn. However, most often consumers on average are reactive, not proactive, thereby de-leveraging only after a recession has occurred because they are cautious due to fear of job losses. The best situation for increases in consumption is when a recession has just ended, and the consumer is starting to increase spending, however often this spending comes with increased leverage. With the current savings rate near its lowest level in history, its suggesting that the economy is in the latter stage of the expansion, which make sense since this recovery is 9 years old and on pace to be the longest expansion in US history next year.
Breakdown Of Income Growth
In the long run income growth is the most important driver of the economy since money saved stays in the economy and is utilized whether in the form of investments or future consumption. If saved in a savings account banks use the capital to make loans. However, an increase in savings can decrease GDP growth in the short-term, since consumer spending is a large component of economic growth in the US. The personal savings rate is volatile, so this is far from a cyclical phase change where the consumers are becoming more conservative.
You are probably curious if the tax cuts are affecting income growth considering the very weak 0.9% real consumption growth in Q1 and the disappointing May reading. The chart below from Ernie Tedeschi shows the decomposition of earnings changes from Q4 2017 to March-May 2018 for average households.
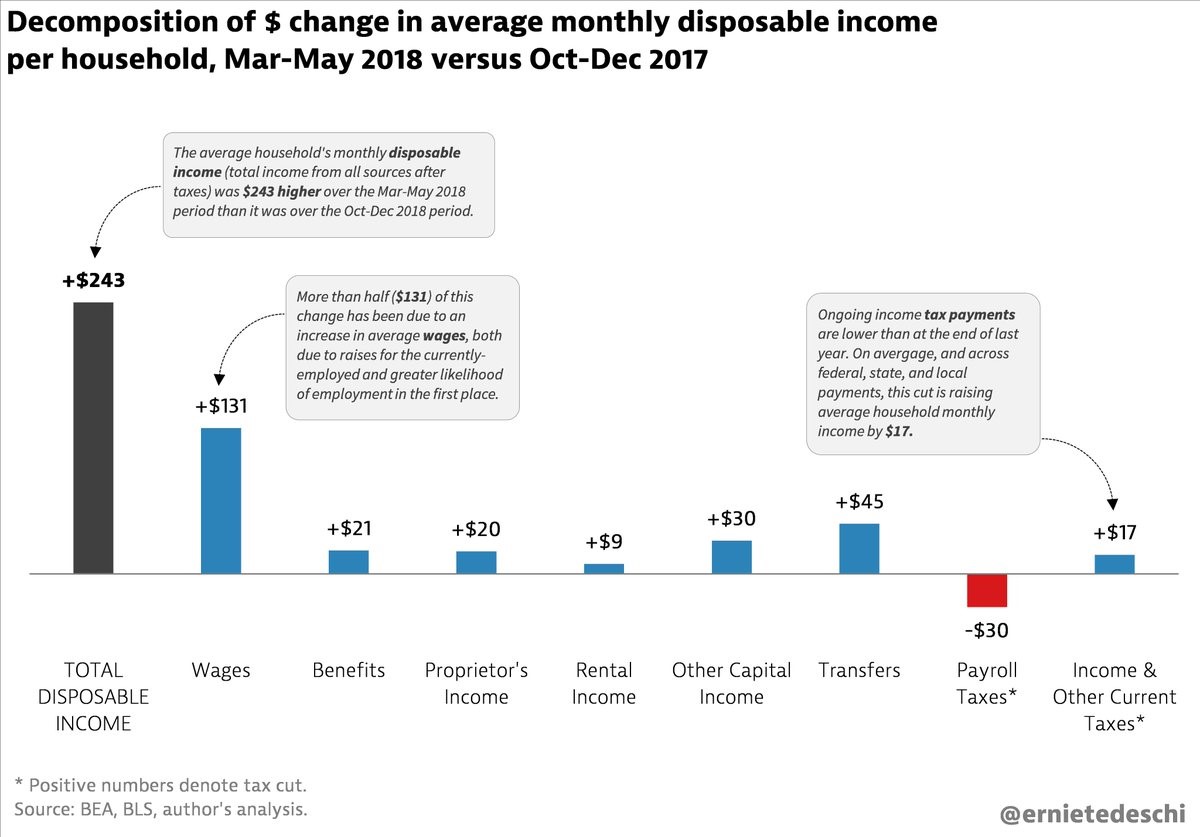
Source: Twitter @ernietedeschi
Disposable income is up $243. The gain is mostly from wage increases. The “payroll taxes” are taking $30 more from disposable income and the “income & other current taxes” add $17 to disposable income. This doesn’t look great for the tax cuts. One counterpoint proponents of the tax cut would make is that the recent jobs growth was created by the tax plan and this has helped wages and benefits. However, job growth hasn’t accelerated since the plan was enacted. On the other hand, nominal weekly earnings growth is strong. It’s debatable how much of the 2018 economic growth is caused by the tax plan.
America Outperforms The World
The US is outperforming the global economy which is showing signs of weakness. In the first half of 2018, the S&P 500 was up 1.7% and the Russell 2000 was up 7.0%. This is much better than the MSCI Developed Markets ETF which was down 4.7% and the MSCI Emerging Markets ETF which was down 8.0%. The manufacturing sector shows clear evidence of outperformance. The JP Morgan chart below shows the global manufacturing PMI from Markit is at an 11 month low in June.
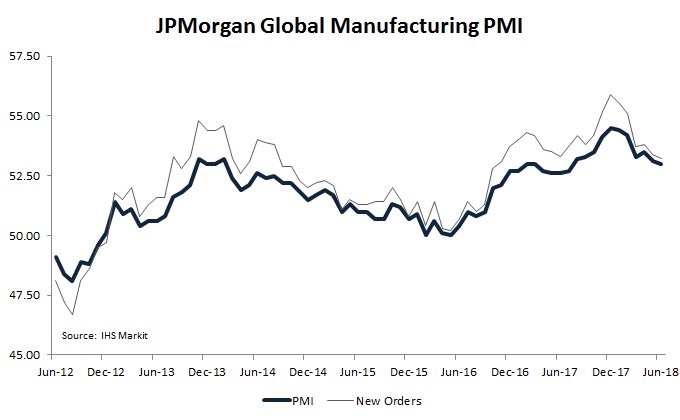
Source: IHS Markit
The new orders index is also declining. The average PMI is still above 50 which means most are increasing. However, the breadth of global manufacturing PMIs is weakening as well. About 75% of manufacturing PMIs are increasing which is the lowest percentage since September 2016.
While the global manufacturing PMI is weakening, both the Markit report and the ISM report show American manufacturing is doing well. The American Markit PMI for June was 55.4 which means the Q2 PMI was the strongest since Q3 2014. On the one hand, the June report was the lowest in 4 months and new orders and output growth were the slowest since November 2017. However, the final reading was much stronger than the flash reading which means the last 2 weeks of the month had a 56 plus point pace.
The ISM Manufacturing report was even better than the Markit report. Its reading of 60.2 beat the highest estimate by 0.2. This was the best report since February 2018 and is consistent with 5.2% GDP growth. Before getting too excited by this report, look at the chart below which shows factory orders haven’t kept up with the ISM PMI.
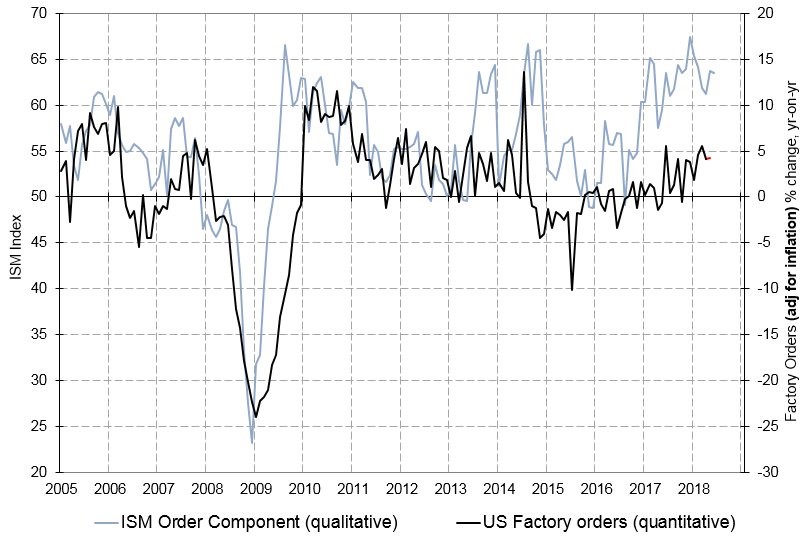
Source: Twitter @takis2910
The GDP projections in the ISM report have been widely optimistic since the index recovered in late 2016. The Atlanta Fed’s GDP estimate jumped from 3.8% to 4.1% partially because of this report and partially because of the construction spending report which showed 4.5% year over year growth driven by 6.6% growth in residential housing spending.
Conclusion
We showed a balanced view of the effects of the tax cuts as disposable income growth wasn’t driven by lower taxes paid, but the strong economy is helping to boost nominal wages. The economic growth acceleration in Q2 may be partially due to the tax cuts and regulatory reform. Furthermore, U.S. manufacturing growth is stronger than the global economy’s manufacturing growth based on the Markit PMI and the ISM PMI. However, the factory orders haven’t kept up with the ISM report, so it should be taken lightly. This all leads us to the Atlanta Fed Nowcast showing 4.1% GDP growth and the CNBC rapid update GDP tracker which averages 11 models showing 3.8% growth.
Have comments? Join the conversation on Twitter.
Disclaimer: The content on this site is for general informational and entertainment purposes only and should not be construed as financial advice. You agree that any decision you make will be based upon an independent investigation by a certified professional. Please read full disclaimer and privacy policy before reading any of our content.


