UPFINA's Mission: The pursuit of truth in finance and economics to form an unbiased view of current events in order to understand human action, its causes and effects. Read about us and our mission here.
Reading Time: 5 minutes
Consumers appear to be correct with the rate of change of their long run inflation expectations. In the latest survey, one year inflation estimates increased 0.1% to 2.8% and 5 year expectations fell 0.2% to 2.3%. As you can see from the chart below, this matches the cycle low for longer run inflation estimates.
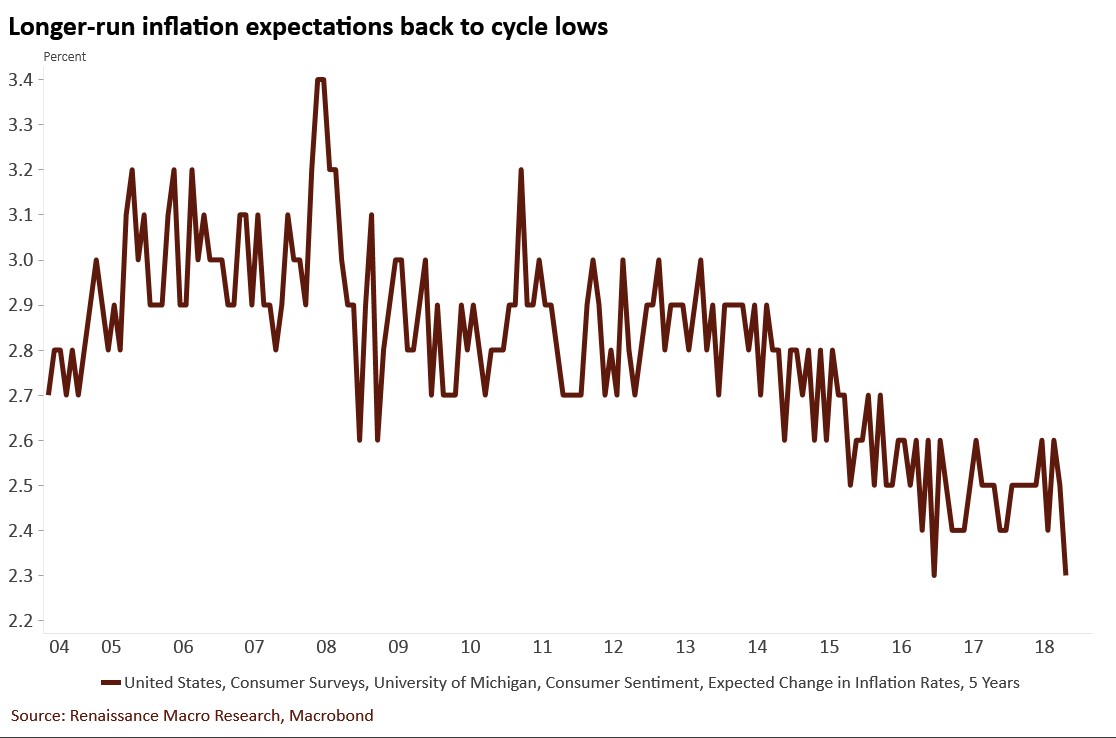
This could indicate the consumer might be able to withstand price increases since nominal wage growth has been strong. It could also mean the consumer has seen this story (of small bumps of inflation) before and doesn’t believe it will last.
Year over year inflation has increased a few times this expansion, but has fallen back down once the comparisons got tougher. Shelter has been the main driver of CPI inflation this cycle as it has been increasing ahead of CPI and is the largest component of the index. Since consumers think housing is unaffordable, price growth could slow. It’s predicted to fall in the ECRI home price index. If this occurs, CPI growth will take a turn lower.
The most interesting facet of this inflation survey is that the Fed is about to hike rates a total of 4 times in 2018 even while consumers have the lowest expectations for inflation in at least 14 years. The only argument in favor of rate hikes is the Fed should have neutral rates if growth is strong. There’s no reason to be contractionary if inflation is modest.
Baby Boomers Retire
Two of the most discussed topics in economics and personal finance are how the labor force participation rate is being suppressed by baby boomers retiring and how many Americans don’t have enough saved for retirement. As an aside, we review the prime age labor force participation rate to get rid of the effect from baby boomers retiring and the effect of young people working less because they are getting educated more than prior generations. The chart below shows both of those highly discussed topics.
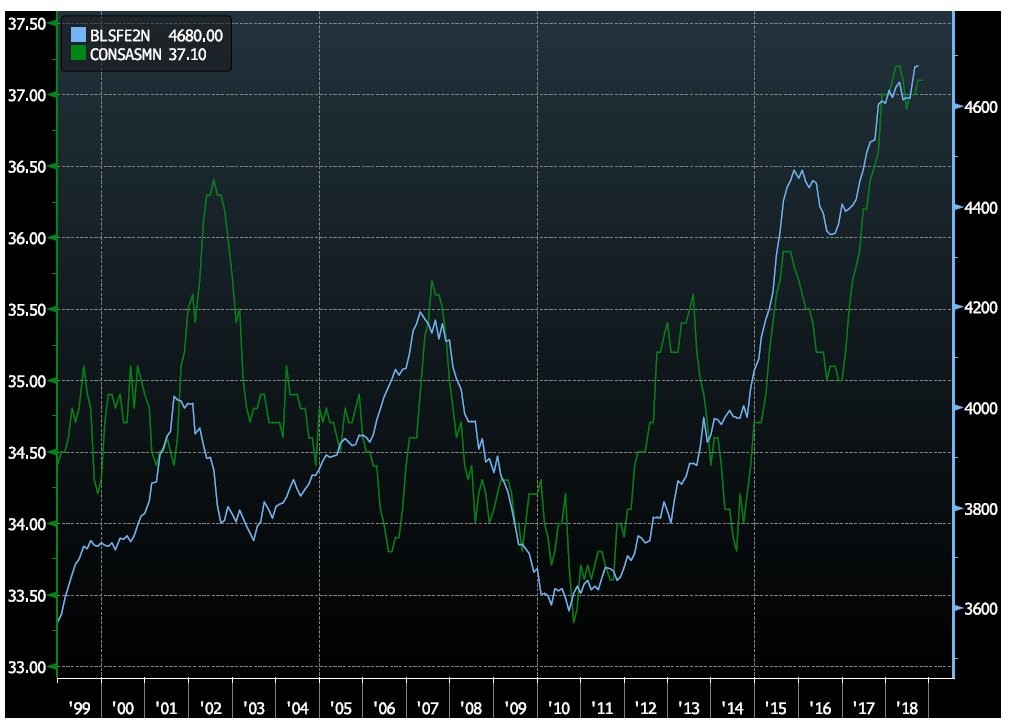
The blue line shows the 12 month moving average of the flow of Americans who have gone from employed to unemployed in the labor force. The green line shows the percentage of Americans who think they’ll have adequate retirement income.
These two metrics are correlated especially recently. Once people retire, they think they’ll have enough retirement income. It’s almost as if people convince themselves they have enough money once they’ve made the move. The two metrics are also affected by the economy, so it’s fair to say the other reason people are more confident in their retirement income is because of market performance and strength in the labor market. While it’s not ideal to have a large portion of your assets in stocks right before your retirement, it still makes sense to have some invested in equities to avoid running out of money. The final point on this is people could be underestimating their monetary needs after retirement. That’s an easy mistake to make if you don’t run the numbers. People are living longer which means they need more money to retire if they don’t work to an older age.
Economy Affects Disability Work Rate
It’s interesting to see how the disability rate could be affected by the labor market because you would think if someone is disabled, they won’t be able to work no matter how much employers need workers. As you can see from the chart below, the number of people receiving disability insurance has been decreasing for the past 3 years.
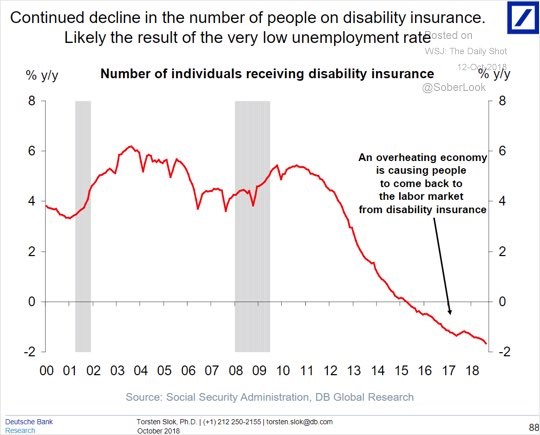
Growth has been falling since 2011. The chart indicates the rate has been falling because of the hot labor market. That only tells part of the story because the labor market hadn’t affected the disability insurance growth rate from 2000 to 2011. Growth was relatively consistent in those years despite the 2 recessions.
As you can see in the chart below, disabled people are coming back into the labor market along with workers who were discouraged. The non-participation rate has fallen after being adjusted for age and gender. 9.6% of disabled prime age workers have found a job 12 months later which is over 3% higher than the bottom in 2010. This is because there is better job training, disabled people are having an easier time finding work, and some people weren’t really disabled.
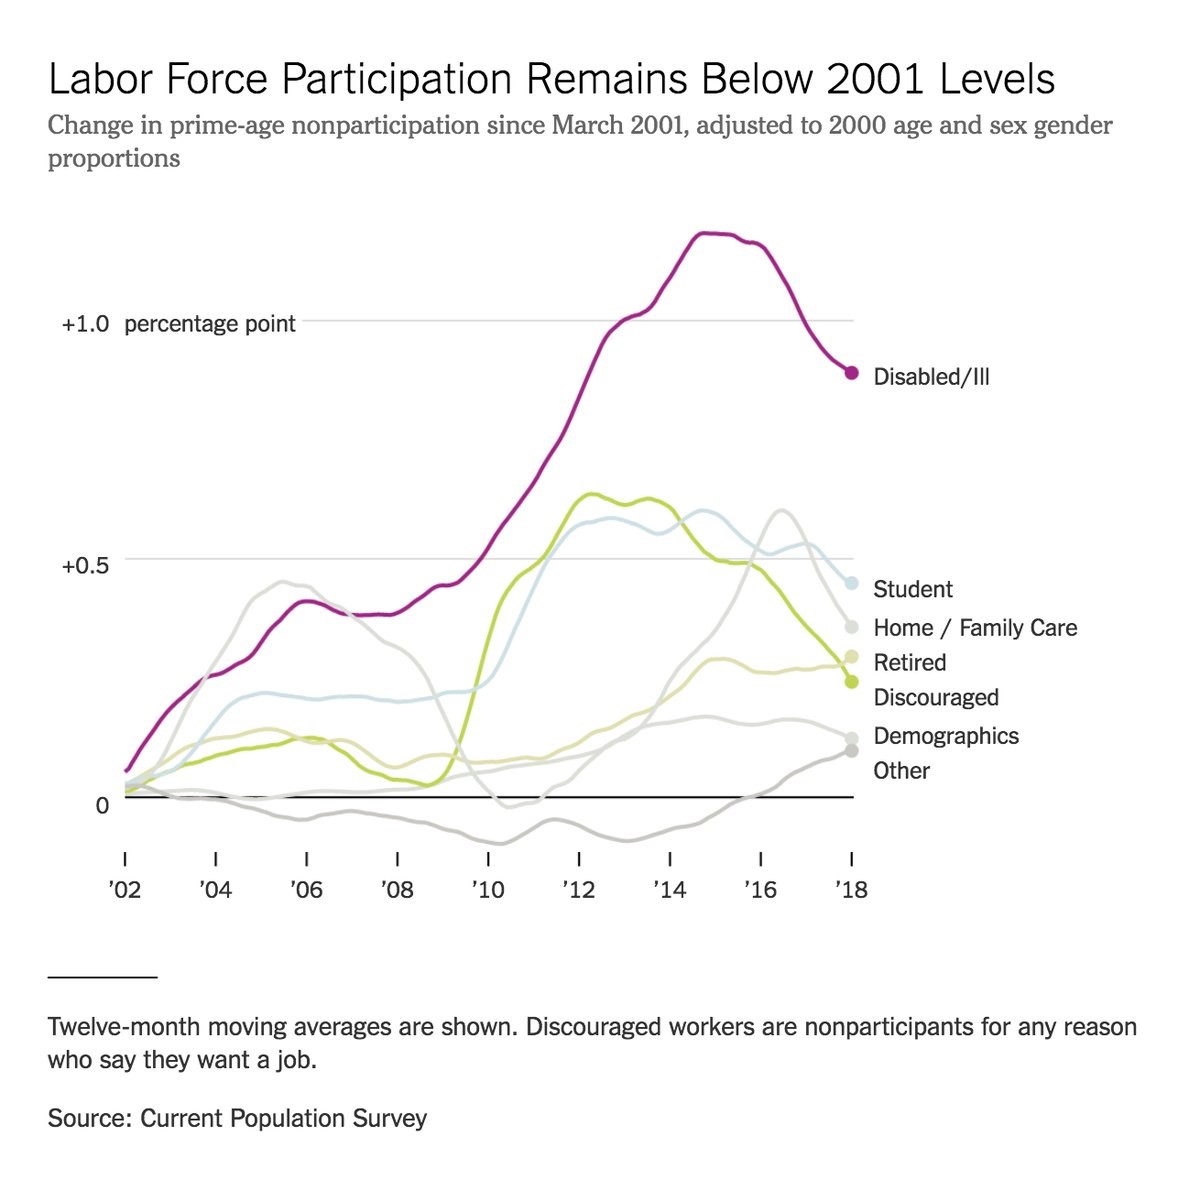
The chart above shows prime age workers because there are some people who age out of social security disability insurance and switch to social security retirement benefits. There is also a possibility the disability insurance decline is caused by the Affordable Care Act’s Medicaid expansion.
Inflation Versus Unemployment
The ratio between the unemployment rate and inflation is a hotly discussed topic because low unemployment is supposed to increase inflation, but it hasn’t this cycle. Another interesting way of viewing the data points is subtracting the inflation rate from the unemployment rate. Since unemployment decreases at the end of the cycle and inflation increases, when the difference between the two is low, it’s a good signal the economy is near the end of the cycle.
As you can see from the chart below, it has been a decent indicator of recessions once it gets close to zero.
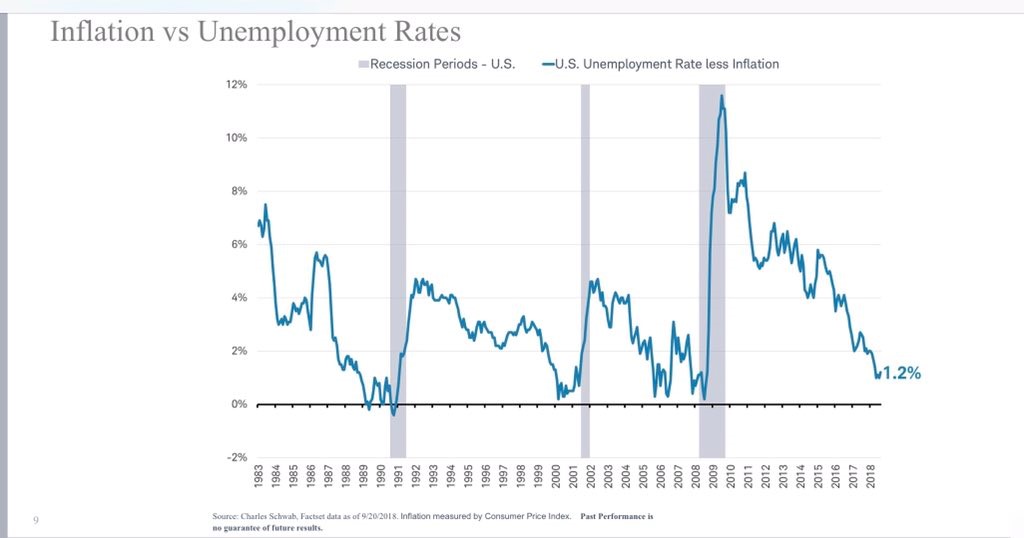
The current rate is 1.2% which is a bit too high for a recession signal. The difference is low because the unemployment rate is low. Inflation is also low which is preventing this metric from being negative. The good news for the cycle is consumers expect 5 year inflation to only be 2.3%. The other good news is the prime age participation rate signals there’s more slack in the labor market than the unemployment rate indicates. There also are some workers who come off disability and get back into the labor market. That will elongate this expansion.
Conclusion
Baby boomers have gotten confident about their retirement savings as they have exited the labor market. Consumers don’t expect a lot of inflation which is great news for retired baby boomers who are on a fixed income. Spiking rates would be a disaster for them. The labor market is so strong, the percentage of disabled people is falling. It’s possible that the strength of the labor market is affecting the percentage of disabled people more now than in past cycles because the nature of work is different. Less physically intensive work is ideal for a physically disabled person. Lastly, the lack of inflation is saving the business cycle from a recession.
Have comments? Join the conversation on Twitter.
Disclaimer: The content on this site is for general informational and entertainment purposes only and should not be construed as financial advice. You agree that any decision you make will be based upon an independent investigation by a certified professional. Please read full disclaimer and privacy policy before reading any of our content.


