UPFINA's Mission: The pursuit of truth in finance and economics to form an unbiased view of current events in order to understand human action, its causes and effects. Read about us and our mission here.
Reading Time: 4 minutes
The headlines from the jobs report were mostly good which is why the S&P 500 rallied to within less than a point of its record high on Friday. However, like most economic reports, the devil is in the details. You might ask how it’s possible that a report which beat job creation estimates, had upward revisions, and saw the unemployment rate fall to a 49 year low was weak. We will explain that in this article. We aren’t looking for a bearish or bullish thesis; we’re just reviewing the data instead of just cheering on whatever the headline says.
Great Headline Jobs Report
First, let’s review the headline numbers. As you can see in the chart below, there were 263,000 jobs added in April which is a fantastic reading this late in the cycle. It beat estimates for 180,000 and the high end of the consensus range which was 240,000. There have only been 23 months with more job creation this cycle. That includes the years where the unemployment rate was high early in this expansion.
The past 2 months saw combined upward revisions of +16,000. The initially terrible February report has been revised up to 56,000. It always seems like whenever there is a bad report, the revisions are higher and whenever there is a great report, the revisions are lower. You can’t fully trust the initial reading of this report, just like the initial reading of GDP.
The Not Great Details: Decline In Labor Force
The big headline after this report was how the unemployment rate fell to 3.6% which is a 49 year low. It’s good to see that rate fall if jobs are being created; it’s not great to see that rate fall if people are leaving the workforce. Both occurred, but more people left the workforce than there were jobs created. There was an enormous 646,000 increase in the number of people not in the labor force. This sent down the labor force participation rate from 63% to 62.8%. That might not seem like a big change, but it is.
The civilian labor force fell 490,000 and the population increased by 156,000. The decline in the labor force came from a 103,000 decline in the number of employed people and a 387,000 decline in the number of unemployed people. As you can see from the chart below, labor supply has fallen recently. It’s down about 750,000 in the past 3 months, explaining the decline in the unemployment rate to 3.6%.
This increase in the number of people not in the work force explains the recent uptick in the chart below. It shows the U6 unemployment rate, which includes marginally attached and part time for economic reasons workers, plus the number of people not in the labor force divided by the civilian non-institutional population.
To be clear, the U6 unemployment rate has stayed at 7.3% for the past 3 months. The uptick here is all about the increase in people not in the labor force. The current percentage of 41.78% is above the 2 previous troughs of 37.32% and 38.87%.
Manufacturing Work Fell
On the positive side, the number of manufacturing workers added in March was revised from -6,000 to 0. However, April job creation of 4,000 missed estimates for 10,000. As usual professional & business services and education & health services added the most jobs as they added 76,000 and 62,000 in April. Retail trade lost 12,000 jobs. Even the details in manufacturing employment show underlying weakness. This jobs report is like a fake dating profile. The allure isn’t real. As you can see from the chart below, the average weekly hours worked plus overtime hours for production workers in manufacturing fell 2.33% yearly. That growth is below the 2015-2016 recessionary low. It’s the worst growth rate since the financial crisis. The mitigating aspect is this reading faced the toughest comp since 2011; the comps will get easier from here.
Decline Work Week Length & Weekly Wage Growth
Average hourly earnings growth was 3.2% which missed estimates for 3.3% growth and was the same as March. Unfortunately, even this part of the report was bad. The average work week length fell from 34.5 hours to 34.4 hours, missing estimates for 34.5 hours. This caused average weekly wage growth to drop as you can see in the chart below. It fell from 3.24% to 2.94% which is the weakest reading since January 2018.
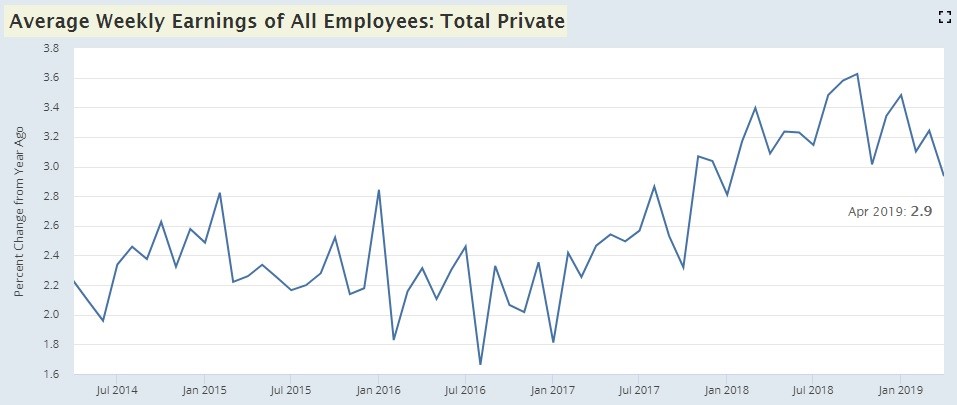
If the labor market was as tight as the unemployment rate implied, we’d see higher wage growth. The low end of the recent range this growth rate had been in was broken. The 0.074% monthly decline in average weekly wage growth was the biggest decline since November 2016.
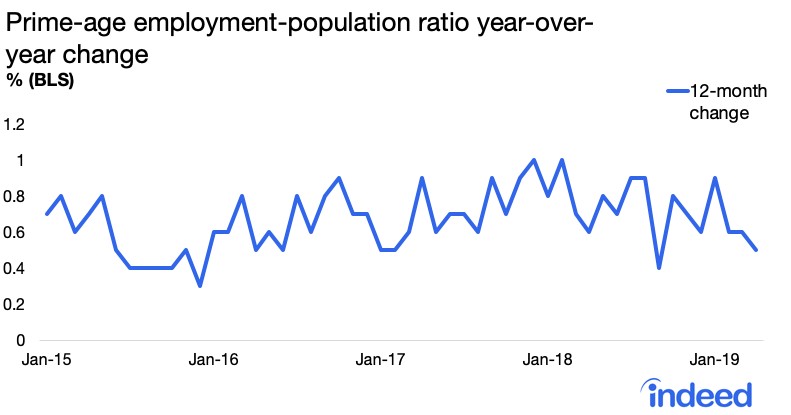
Prime Age Labor Participation Rate Falls
Since the overall labor force participation rate fell significantly, it’s no surprise that the prime age labor force participation rate fell. The prime age labor force participation rate fell from 82.5% to 82.2%. The monthly decline of 0.36% was the worst since September 2014. The chart below depicting the yearly growth in the prime age employment to population ratio shows a similar decline.
R&D Explodes
For all those people who complain about productivity growth being low because of a lack of investment, feast your eyes on this chart.
R&D investment growth and scientific research development services employment growth have spiked. The latter’s growth rate is 5.7%. If you’re curious, the recent Q1 2019 productivity report showed quarterly productivity growth improved from 1.3% to 3.6% which beat estimates for 1.9%. Unit labor costs fell 0.9% quarterly which missed estimates for 1.9% growth and 2.5% growth in Q4. Hours worked increased 0.5% and output increased 4.1%. Real compensation growth was 1.7% which was down 0.6% from Q4.
Conclusion
This April labor report, which showed the unemployment rate fall to the lowest level in 49 years and job creation beat estimates, wasn’t good. The number of people in the labor force crashed which pushed down the labor force participation rate and the unemployment rate. Furthermore, the decline in the length of the work week pushed weekly earnings growth down to the lowest level since January 2018 just when you would think wage growth would be increasing because the labor market is relatively tight and job growth is above population growth.
Have comments? Join the conversation on Twitter.
Disclaimer: The content on this site is for general informational and entertainment purposes only and should not be construed as financial advice. You agree that any decision you make will be based upon an independent investigation by a certified professional. Please read full disclaimer and privacy policy before reading any of our content.


