UPFINA's Mission: The pursuit of truth in finance and economics to form an unbiased view of current events in order to understand human action, its causes and effects. Read about us and our mission here.
Reading Time: 5 minutes
One big misnomer is that stock buybacks have caused a massive bubble in stocks. This is something we have discussed in depth on multiple occasions. The supposed support for this argument is buybacks reached a record high before the last recession; now they are at a high again. Firms buy back stocks as one way of returning capital to shareholders. Naturally, when profits increase and management doesn’t see any other investment opportunities, buybacks increase. Buybacks are more responsive to profits than dividends because firms make sure to keep dividends manageable, so they will only be cut in an extreme situation. Investors like firms that have paid a dividend for a long time and haven’t cut it, which is why firms try to maintain their consistency with dividend policy.
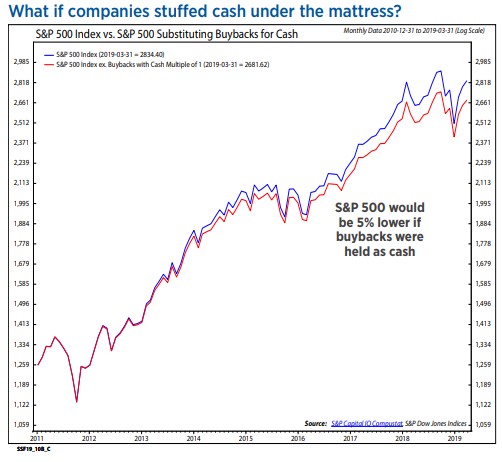
The most fallacious argument buyback bubble critics make is when they state where stocks would be without buybacks while ignoring where that capital could have gone. According to Ed Clissold of Ned Davis Research, the S&P 500 would be 19% lower if buybacks vanished and the money disappeared. The money would go somewhere, if it didn’t go to buybacks. As you can see from the chart below, the S&P 500 would only be 5% lower if the money used for buybacks was held as cash. So much for buybacks creating a massive bubble in stocks.
The S&P 500’s total return would be 10% lower if buybacks were replaced with dividends. If buybacks were replaced with reinvestments, the S&P 500 would be 2% lower. It’s very easy to claim firms should just invest their excess capital in their businesses. However, when you’re actually running the business you need figure out if the rate of return and the risk makes sense for investors. If it doesn’t, firms return the money to shareholders. Since 2011, investors have liked when firms buy back stock or keep the cash. Stocks where firms invested the money in capex did the worst, something we discussed in the past. In 2019, the S&P 500 buyback ETF (symbol SPYB) is up 18.41% and the S&P 500 is up 16.38%.
Investors Are In Love With Treasuries
2019 has been an interesting year because both stocks and treasuries have rallied. Stock investors like when profits rise, which implies a strong economy. Bond investors like when growth and inflation are weak. We’ve certainly seen a decline in inflation as yearly headline PCE inflation growth was 1.5% in March. We also have seen weak real GDP growth excluding inventory adjustments and trade as real final sales growth to domestic purchasers was the lowest in 6 years in Q1.
This explains the chart below which shows the JP Morgan all client net long treasury investor sentiment index is the highest since the summer of 2016 when the 10 year yield was below 1.5%.
In the past 5 years, this index has given 4 good trading signals and 2 bad ones. The last 2 were bad. That record is if you bet against the crowd. Near term bond yields can increase if the Fed keeps to its plan to raise rates once next year. Long term bond yields can increase if the slowdown ends late this year like the ECRI leading index projects.
Zero Dissents Per Meeting
Powell’s tenure has been unusual because, as the chart below shows, there have been zero FOMC dissents per meeting. The last Fed chair with zero dissents per meeting was Thomas McCabe who was chair from 1948 to 1951. In his short term from 1978 to 1979, Will Miller had 1.42 dissents per meeting.
The toughest decision the Fed has had to make under Powell is raising rates in December 2018 when economic growth was slowing and the stock market was crashing. The Fed soon caved afterwards and changed its guidance for 2019 to zero hikes which was down from 2 hikes. Dissenting votes can tell us which way the Fed is leaning in, but since there haven’t been any, we have nothing to go by. All we can say is the Fed’s guidance for no hikes or cuts in 2019 must be pretty firm if no FOMC members disagreed at the May 1st meeting.
Weak ISM Manufacturing PMI
Because all but one of the regional Fed manufacturing reports missed estimates, it’s no surprise that the April manufacturing PMI missed estimates sharply. It came in at 52.8 which was below the consensus of 55 and March’s reading of 55.3. The PMI reading has been overly optimistic recently, which is why this PMI on a historical basis isn’t actually bad.
As you can see from the chart below, the PMI is in the 44th percentile based on data since 1950.
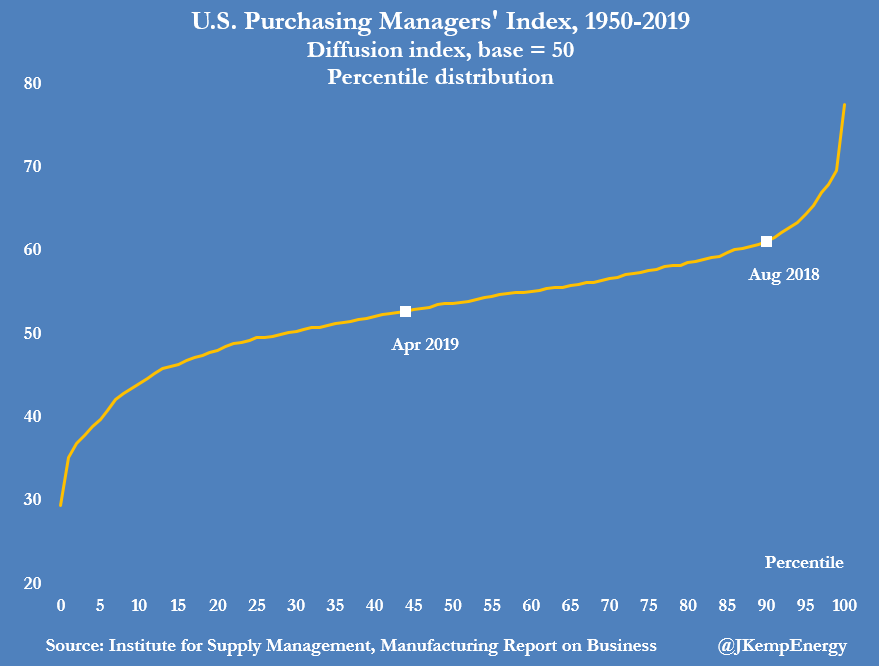
In August 2018, the PMI was in the 90th percentile. Manufacturing growth is weaker than last year, but it’s not as bad as it was in 2015 and 2016 during the last manufacturing recession. This PMI is consistent with GDP growth of 2.9% which would be a solid quarter. However, it was the lowest reading since October 2016 when the manufacturing sector was emerging from its recession.
The new orders index fell 5.7 points to 51.7. The production index fell 3.5 points to 52.3. The prices index fell 4.3 points to 50 which is consistent with the low inflation reading in the March PCE report. In the comments section, there were concerns about tariffs and Mexican border issues.
Markit PMI Improves
Unlike the ISM PMI, the Markit PMI improved from 52.4 to 52.6. New business growth increased to a 3 month high which increased output growth, but employment growth was the weakest since June 2017. This PMI means manufacturing dragged the economy lower because it was below 53.5. The rate of contraction fell.
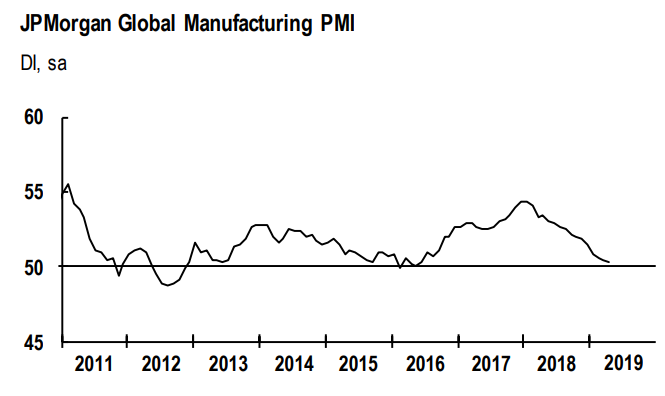
As you can see from the chart below, the global manufacturing PMI fell from 50.5 to 50.3 which was its lowest reading since June 2016.
Business optimism fell and had the 4th worst reading since this data started being calculated in July 2012. The output index and new orders index both improved by 0.2 to 50.5 and 50.1. However, the future output index fell from 60.2 to 59.8.
Global manufacturing employment growth was the weakest since September 2016. New export business fell for the 8th straight month and the European PMI fell for the 3rd straight month. This decline in Europe was driven by Germany. China’s PMI was 50.2. The best readings came from Greece, Myanmar, the U.K., Ireland, and America. Finally, price inflation for inputs and outputs was the lowest in 31 months.
Have comments? Join the conversation on Twitter.
Disclaimer: The content on this site is for general informational and entertainment purposes only and should not be construed as financial advice. You agree that any decision you make will be based upon an independent investigation by a certified professional. Please read full disclaimer and privacy policy before reading any of our content.


