UPFINA's Mission: The pursuit of truth in finance and economics to form an unbiased view of current events in order to understand human action, its causes and effects. Read about us and our mission here.
Reading Time: 4 minutes
Sometimes investors get confused about how earnings affect stocks. Stocks trade based on future earnings expectations. The latest earnings report gives us the best clue as to how that future will turn out. Analysts make their estimates based on company guidance. That’s why changes to analysts’ forecasts correlate with stocks. Some inexperienced investors might be confused why stocks usually rise while estimates fall. Estimates start high and meander lower. If they fall at a slow pace or rise (which is rare), it’s good news; if they fall sharply, it’s bad news. Saying stocks should fall because estimates fall would be the same thing as saying stocks should rise because estimates are beaten. Both are incorrect. Aggregate estimates are almost always beaten. Companies usually give “beatable” guidance.
You need to know how the game is played to understand the results. The final mistake investors can make is believing high, long term future estimates. It’s not a positive if earnings estimates 12 months or further in advance are optimistic because they are usually strong unless the economy is in a recession. Analysts often start with a base case scenario of about 8%-10% growth and work from there. When comps are high, estimates are lower and when comps are easy, estimates are higher.
The first two months of 2019 were rare because estimates crashed the most in 3 years, but stocks rose. Investors ended up being correct as Q1 has been a good earnings season. We know it has been a good earnings season by the changes to Q2 estimates. As you can see from the chart above, Q2 estimates fell 1% in April. Q1 estimates fell a dramatic 4.6% in January. The Q2 decline is less than average. The average decline in the first month of a quarter in the past 5 years is 1.7%. In the past 10 years, the average decline is 1.4% and it’s 1.8% in the past 15 years.
Mixed Senior Loan Officer Survey
We discounted some of the weakness in the Federal Reserve’s Senior Loan Officer Opinion survey in January because that was a highly uncertain time. Financial conditions were tight as there just was a mini-bear market. Plus, there was a government shutdown underway. Now we have results from Q2 when the government was open and financial conditions were loose. This report was mixed, as it may have been helped by improved financial conditions, but hurt by the Fed’s rate hikes last year. Some of the surveys are consistent with the Q1 GDP report which showed real final sales growth to domestic purchasers was the worst in 6 years.
First, we have information on commercial and industrial loans. The net percentage of domestic respondents citing tightening lending standards for large and medium firms fell from 2.8% to -4.2%. For small firms, it fell from 4.3% to 0%. Keep in mind, fewer seeing tightening standards is a good thing. We saw the net percentage of respondents increasing spreads of loan rates over banks’ cost of funds fall. This reading was helped by the loose financial conditions. For large and medium firms, the net percentage fell from 4.2% to -27.5% which is a huge decline. For small firms, it fell -4.4% to -14.7%. Declines are good news here.
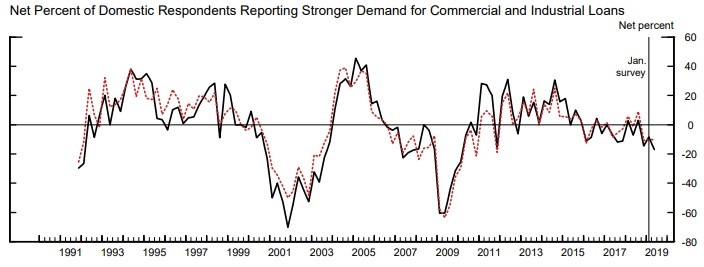
Finally, as you can see from the chart below, the net percentage of domestic respondents reporting stronger demand for C&I loans fell. The decline was mostly in large and medium firms as it went from -8.3% to -16.9%. For small firms, it went from -10.1% to -10.3%. Here a decline is bad news.
Now let’s look at the 3 questions on consumer loans. The chart below shows the net percentage of respondents reporting tightening standards for consumer loans.
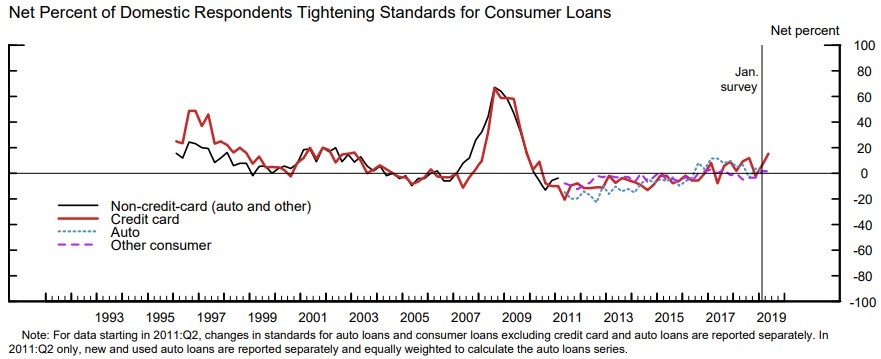
There was sharp tightening in credit cards as the percentage increased from 6.4% to 15.2%. New and used autos fell slightly to 1.8% from 1.9%. Consumer loans outside of credit cards and autos stayed the same at 1.7%. As you can see, the net percentage tightening standards for credit cards is the highest since Q4 2009. This is obviously bad news. However, it’s only 3.2% higher than Q3 2018.
The net percentage reporting increased willingness to make consumer installment loans increased from 1.6% to 4.9% which is good. Finally, let’s review demand for loans. The net percentage reporting stronger demand for credit cards increased from -17.4% to -6.8% which is good. For autos, it spiked from -18.2% to -1.8%. For loans excluding credit cards and autos, it fell from -14.8% to -15.5%.
JP Morgan Global Markit PMI
In this section, we will review the services and composite PMI, since we already reviewed the manufacturing PMI in a previous article. However, we’d be remiss to not include the chart below which shows this is the longest losing streak for global manufacturing PMI in 20 years. Keep in mind, it’s not as weak as the 2008 financial crisis; it’s just a longer streak.
The services PMI has covered up for the manufacturing weakness, but not so much in April as the output/activity index fell from 53.7 to 52.7 which is a big drop. This is a 3 month low. It is below the long run average of 54.2. Germany, China, and Ireland, had the fastest growth and only Brazil saw outright declines. Global new business fell from 53.9 to 53.
This service sector weakness explains the decline in the composite output index. As you can see from the chart below, it fell from 52.7 to 52.1 in April. The global economy has a higher chance of witnessing a recession the longer the weakness continues.
The nations with the fastest growth were Ireland, Russia, America, Spain, and China. Italy was the only country in decline. Global new orders fell from 52.8 to 52.2.
Conclusion
Q1 S&P 500 earnings season was stronger than average because Q2 estimates fell less than average. The loan officer survey was mixed. There was a decline in demand for C&I loans and a tightening of credit card standards. The global services PMI fell 1 point, catalyzing the composite PMI to fall to 52.1. Further weakness would put the global economy at an increasing risk of a recession. Luckily, America is outperforming in both manufacturing and services.
Have comments? Join the conversation on Twitter.
Disclaimer: The content on this site is for general informational and entertainment purposes only and should not be construed as financial advice. You agree that any decision you make will be based upon an independent investigation by a certified professional. Please read full disclaimer and privacy policy before reading any of our content.


