UPFINA's Mission: The pursuit of truth in finance and economics to form an unbiased view of current events in order to understand human action, its causes and effects. Read about us and our mission here.
Reading Time: 4 minutes
The number of public companies in America has been declining in the past 20 years. Today there are 3,671 publicly listed firms. This is a 46% decline from the peak of 8,025 in 1996. There aren’t enough stocks to make up the Wilshire 5000. The blue line in the first chart below shows the decline in public firms.

Number Of Public Firms Is Down & Concentration Is Up
There is the same number of firms as in the 1970s even though the economy is triple the size. If the trend continues for a few more years, there won’t be enough firms to fill the Russell 3000. Against what you would think, the decline in the number public firms hasn’t come because of the increased prevalence of private firms, since the number of private companies has also declined. This goes against intuition because the number of unicorns ($1 billion startups) has increased. The decline in the number of public companies also hasn’t occurred because international players are taking share in America; public firms have been increasing at the same rate as import growth.
Concentration Has Increased
As you can see from the orange line in the top chart, the concentration of firms has increased. Big firms are taking more share from the small ones or just buying them out, as we have discussed previously. Concentration is higher than at any point since the 1980s. The 2nd chart shows what you’d expect as a result of share gains- the size of the median and average firm has increased. Another interesting fact is the average length of time a firm stays publicly listed has increased from 12 years to 18 years in the past 20 years. The total number of IPOs has shrunk from 300 per year from 1980-2000 to 100 per year since 2000.
M&A And Tech Has Increased Concentration Of Industries
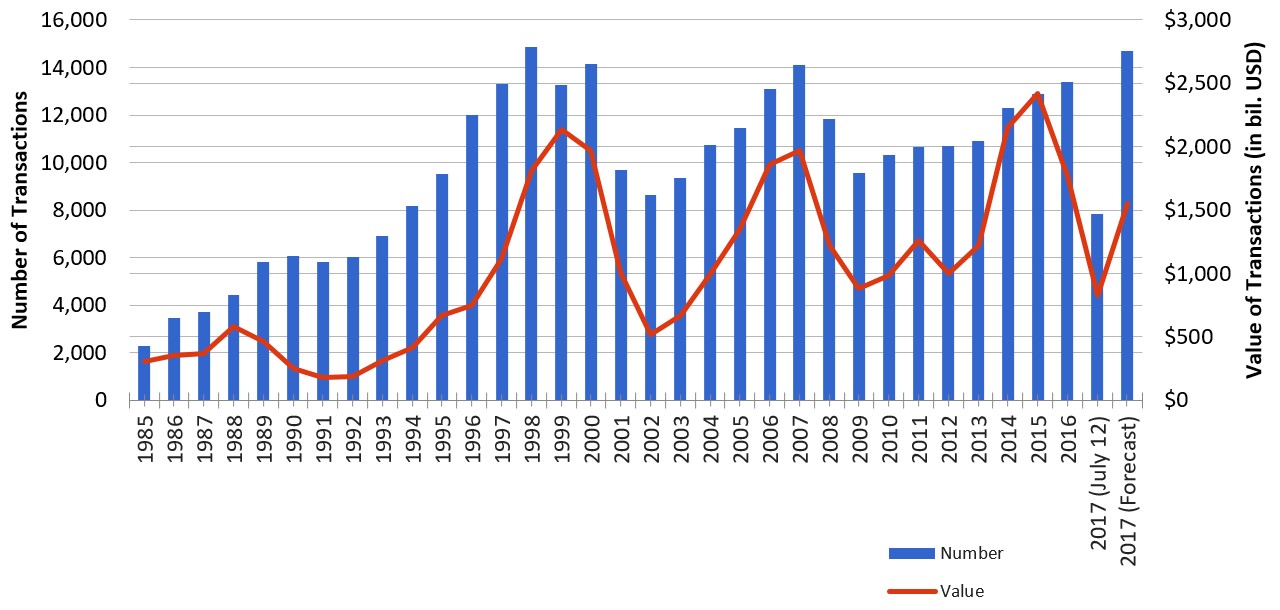
The increase in concentration has occurred in 90% of industries. Regardless of whether regulators are to blame for the increased concentration in industries, it’s easy to see how the increase in M&A has caused industry concentration. The chart below shows the M&A activity started to ramp up right before the number of public companies started on their decent lower.

M&A Really Ramped Up In The 1990s
The other part of the concentration puzzle is technology. Ever since the technology sector gained prominence in the late 1990s, the number of public firms has fallen (with help from the internet revolution in the 2000s). The initial drop in the early 2000s was likely because the dot com firms with no business plans went bust. The number of public firms in the 1990s was boosted by the speculative bubble, making it unsustainable.
Since the tech bubble burst, the number of firms has fallen as tech giants like Amazon and Google have gained prominence. Even though you’d think because the ability to make a website is easy, their moats would be small, having such large mindshare makes it’s tough for competitors to level a threat. Because they have earned so many profits from their high market share, they are able to constantly invest in new businesses and buy up small ones. Their ability to invest in the right new initiatives is another reason they remain behemoths. We’ve done an article on why breaking up the tech giants is a bad idea.
Lower Number Of Stocks Doesn’t Mean Stocks Will Go Up
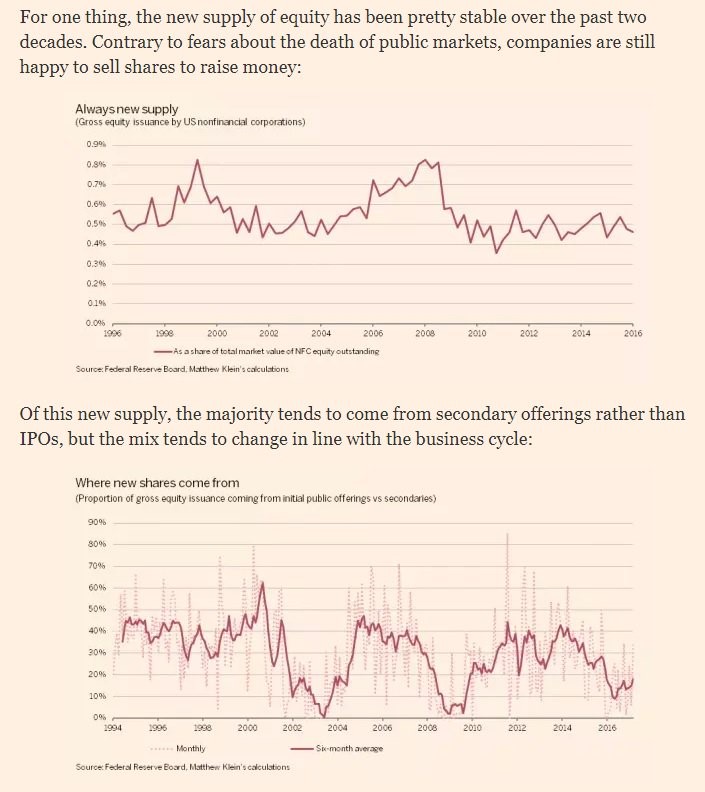
Saying the number of public companies falling makes each stock go up is like saying a stock is cheap because it has a low share price. Both are examples of incorrect logic. Firstly, if public firms are gaining market share, then their valuation will increase. That’s not because there are less stocks available; it’s because their profits are increasing. The charts below explain why fewer public companies don’t shrink the shares available.

Number Of Stocks Declining Doesn’t Boost Stocks
The first chart shows the supply of new equity. Even with the increased popularity of buybacks and the lower number of public companies, the gross equity issuance as a percent of NFC equity outstanding is still at healthy levels. The percentage in the 2000s was just as high as it was in the 1990s even as there were less companies.
The second chart shows why this is the case. The chart shows the relative percentage of gross equity issuance that comes from initial public offerings versus secondaries. When the line goes below 50%, it means more comes from secondaries and when it goes above 50%, it means more money comes from initial public offerings. The 6 month average is almost always below 50%. The percentage varies cyclically since more firms do IPOs when the financial conditions are stable and few do IPOs when there’s a recession. The point of this chart is to show that usually equity issuance comes from secondaries more than IPOs, so the decline in the number of IPOs doesn’t have as much of an effect on equity issuance as you’d expect.
Conclusion
The question up for the most debate is whether the increase in concentration of firms is bad for society. In theory, when the level of competition is the highest, it means consumers are getting the best products/services. As long as there is free choice and firms which are gaining high concentration are doing it because people are freely choosing their product or service, there shouldn’t be a problem. The worst policy response would be to see this information and decide to regulate with an iron fist regardless of whether firms are acting an anticompetitive manner. Eliminating free trade would mean consumers are subsidizing lesser products.
Have comments? Join the conversation on Twitter.
Disclaimer: The content on this site is for general informational and entertainment purposes only and should not be construed as financial advice. You agree that any decision you make will be based upon an independent investigation by a certified professional. Please read full disclaimer and privacy policy before reading any of our content.


