UPFINA's Mission: The pursuit of truth in finance and economics to form an unbiased view of current events in order to understand human action, its causes and effects. Read about us and our mission here.
Reading Time: 5 minutes
In this article, we will review some stats which describe the increase in intense poverty and despair in America. The upper class and the lower class are increasing as the middle class shrinks. This data isn’t necessarily meant to make you sell stocks and put your money in a mattress. Rather, it’s meant to educate you on the terrible economic situation too many people are in. It’s wrong to think the economy is improving for everyone because the S&P 500 is up and the unemployment rate is down as we discussed previously. Our publication is apolitical, therefore we don’t endorse or oppose any politicians, but when President Trump referred to the ‘forgotten men and women’ on the campaign trail, he made a very good point. Many commentators act like everyone is doing amazingly or at least improving economically, but that’s not the case. There has been an increase in the number of downtrodden people in society.
Where Are The Savings?
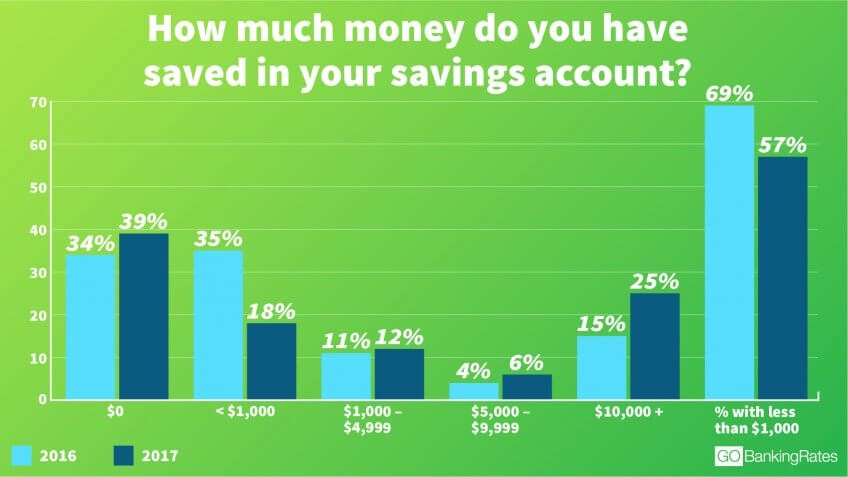
With the advancement of the internet and low cost ETFs, it’s cheaper and easier than ever to start an investment account. The problem is Americans don’t have the savings to invest. They might be tech savvy enough to create a brokerage account, but they don’t have the savings to take advantage of this innovation in finance. As you can see from the Go Banking Rates chart below, 39% of Americans have no money in savings.
Source: Go Banking Rates
The common suggestion, which we agree with, is to have at least 6 months of expenses in savings in case of an emergency. This stat that 39% have no savings lines up perfectly with the stat we discussed in a previous article which showed 41% of Americans don’t have the cash to deal with a surprise expense of $400. You can’t deal with that type of expense without money in a savings account. This stat is more dire than the $400 Fed survey showed because that one was improving. This chart shows 5% more people in 2017 don’t have money in a savings account than in 2016. There’s no question low interest rates may prevent some people from carrying a savings account even though they have capital available. The comparison between the two years adjusts for that since rates were low in both years. Those with more than $10,000 in savings increased from 15% to 25% giving us an example of how the percentage of people in the “upper class” is growing.
Prison Populations Remain High
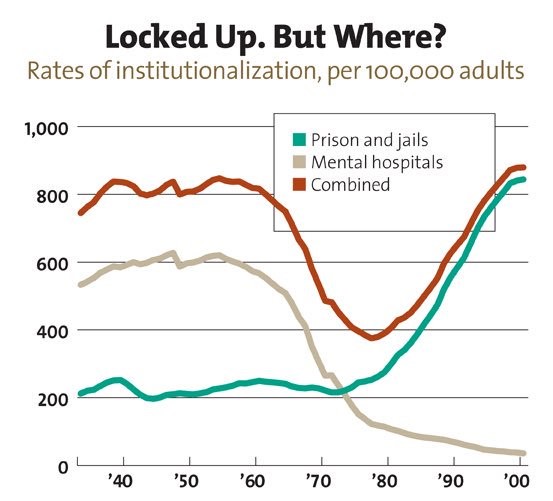
The prison population exploded in the 1980s and 1990s as shown in the Think Progress chart below. Even though in recent years, the prison population has fallen, America still has the highest incarceration rate in the world.
Source: Think Progress
The closing of most mental hospitals has led many mentally impaired individuals to wind up in prison. The de-institutionalization movement in the 1960s caused most of these mental institutions to be closed because the opinion in the country changed about how to ethically treat the disabled. The change occurred without a solution to the problem. The disabled have been largely displaced without good treatment being provided.
Patient rights make it difficult for family members to put a disabled person in a mental health facility and the amount of mental health facilities hasn’t grown to keep up with this influx of disabled people, which in large part is a function of a growing population. Disabled people are going to jail for small crimes and getting stuck there for years. Imprisonment can be as bad as the poor treatment they received at the mental wards. The solution of closing mental hospitals is similar to deciding to close all fast food restaurants to combat obesity. It could be tougher to find unhealthy food, but it doesn’t solve the root cause of the issue and doesn’t provide new healthier restaurants for people to eat at.
Homeless Is Soaring
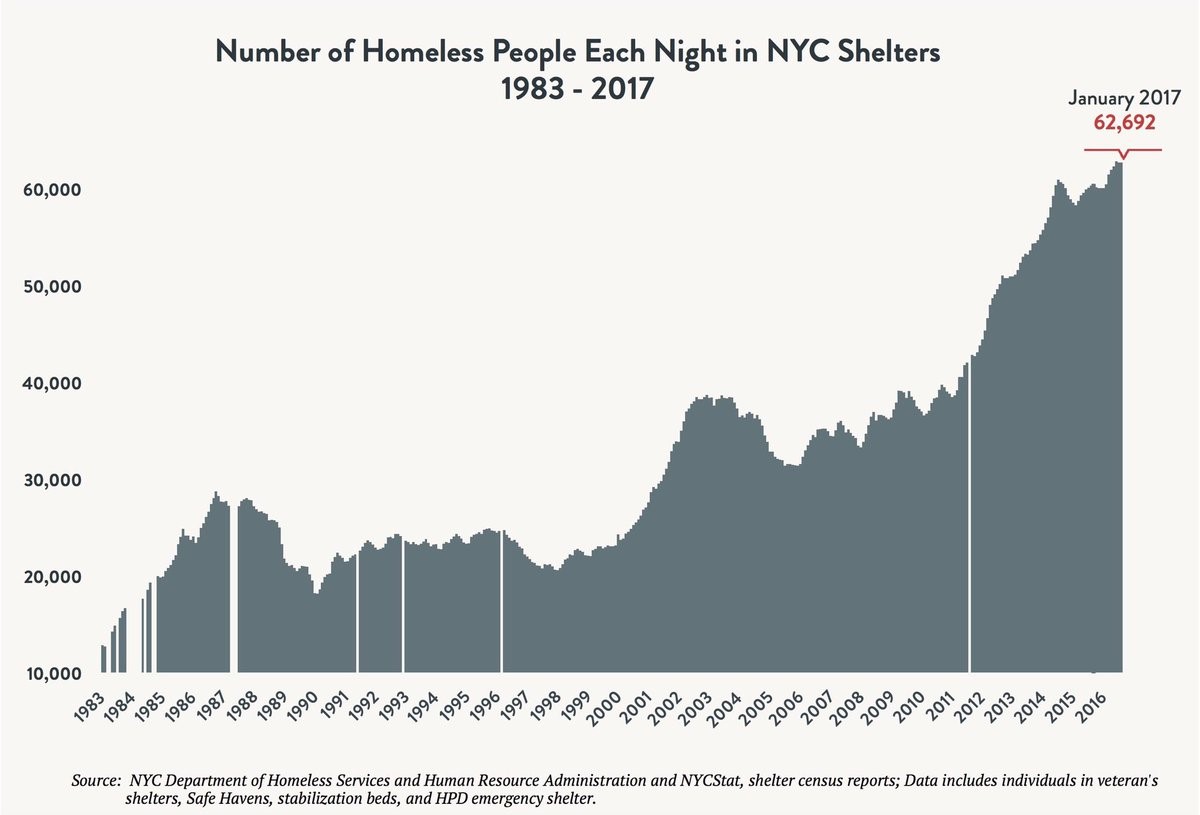
When you look at the unemployment rate, you would assume the homelessness is improving. However, when you hear about the mental health crisis and people’s lack of savings, it’s not shocking to see the Coalition For The Homeless chart below which shows the number of homeless people in New York City has soared. To be frank, this is a stat most people on Wall Street are insulated from. There are statistics which show global extreme poverty is at historic lows which is a great sign, but all is not well for everyone even in America. The big cities have huge housing problems. Homelessness in NYC has more than doubled since the turn of the century.
Source: Coalition For The Homeless
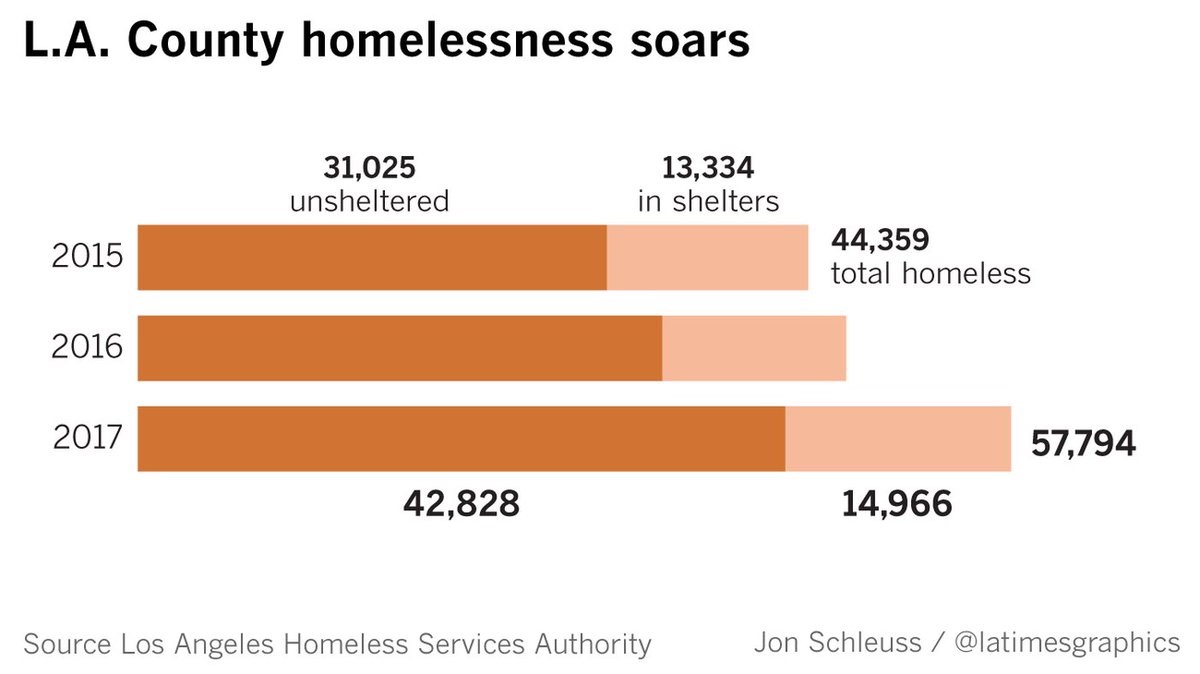
The homelessness crisis isn’t a New York City specific issue. The number of unsheltered homeless people in Seattle has increased from 2,759 in 2010 to 5,485 in 2017. As you can see from the LA Times chart below, the number unsheltered homeless people in Los Angeles has increased from 31,025 in 2015 to 42,828 in 2017.
Source: LA Times
That’s a 38% increase in 2 years. Those are supposed to be years where the economy expanded and helped working class Americans. The unemployment rate in January 2015 was 5.7%; in December 2017, it was 4.1%. We aren’t denying some people have seen improvements, but the poor haven’t.
Housing Isn’t Affordable
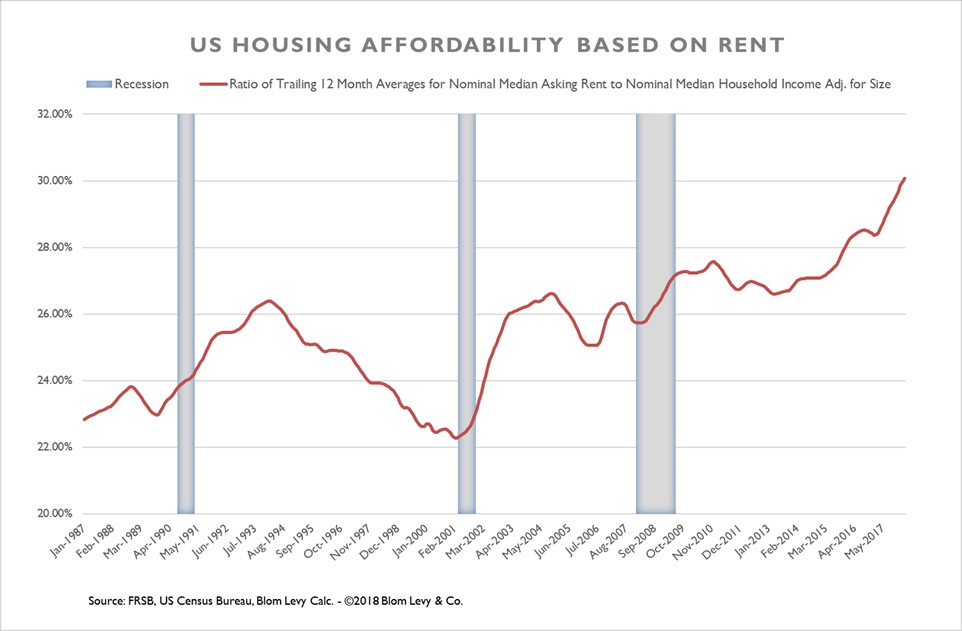
The elephant in the room which is having a big impact on homelessness is affordable housing. The average house in Seattle cost $385,000 in 2010 and in 2017 it cost $700,000. Furthermore, the average rent went from $1,769 per month to $2,650. The chart below from Blom Levy shows how rent has become increasingly unaffordable for many Americans.
Source: Blom Levy & Co
The red line shows the trailing 12 month ratio of nominal median asking rent to nominal median household income adjusting for size. Rent has eaten up 8% more of American’s paychecks since 2001. Skyrocketing housing costs have taken their toll on the poorest Americans.
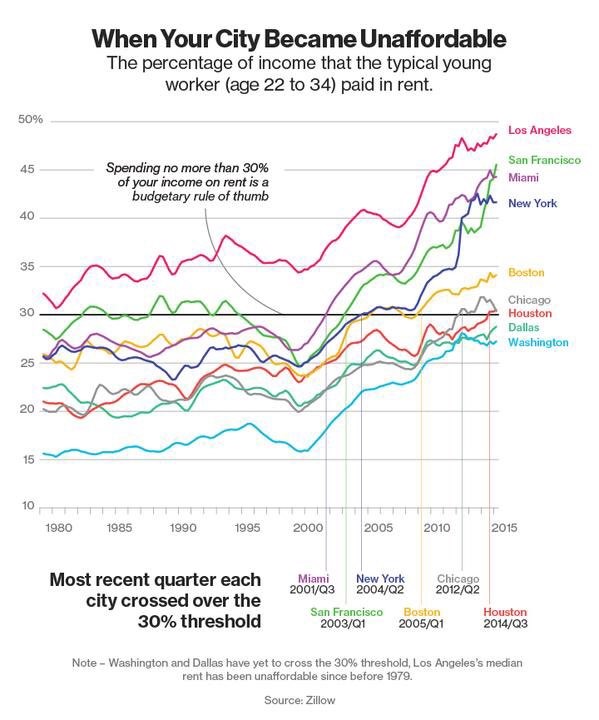
The Zillow chart below shows the problem is particularly bad for young people.
Source: Zillow
Those ages 22 to 34 in Los Angeles pay almost 50% of their income in rent. All the major cities listed below have seen increases in rent expenses compared to incomes since 2000. Los Angeles, San Francisco, Miami, New York, Boston, Chicago, and Houston have all surpassed the general rule of thumb which is rent should be no more than 30% of income. This explains why 41% of millennials ages 25-34 don’t have any money in a savings account.
Conclusion
The economy has improved for those in the top half of income earned, but for the poorest Americans the situation is dire as they face a housing affordability crisis and are living paycheck to paycheck. Homelessness, the percentage of people with $0 in a savings account, and incarceration are all major issues. These are the problems ignored when people only focus on the asset value appreciation in America which only helps those who own assets.
Have comments? Join the conversation on Twitter.
Disclaimer: The content on this site is for general informational and entertainment purposes only and should not be construed as financial advice. You agree that any decision you make will be based upon an independent investigation by a certified professional. Please read full disclaimer and privacy policy before reading any of our content.


