UPFINA's Mission: The pursuit of truth in finance and economics to form an unbiased view of current events in order to understand human action, its causes and effects. Read about us and our mission here.
Reading Time: 5 minutes
One of the biggest stories in personal finance in May came from the 2017 Report on the Economic Well-Being of Households from the Fed. The report has over 60 pages of interesting data points which mostly includes stats on the personal finance of Americans, but also touches on the opioid crisis. The media doesn’t have time for nuanced discussion as the attention spans of their audience have declined rapidly. Therefore, the big headline from the report was that 4 in 10 households, if faced with an unexpected expense of $400 would not be able to cover it or would pay for it by selling something or borrowing money. This was the shocking headline which drove clicks.
Delving Into The Shocking Headline
The shock factor of that stat is that the economy is supposed to be doing well since the unemployment rate is 3.9%. The concept that everything is perfect is clearly not the case as wage growth has been disappointing and student loan debt is still strangling the finances of millennials. Those who rely on mainstream media reports which show the economy must be perfect because stocks are up and unemployment is down are surprised by this survey, but struggling median Americans sure aren’t.
To be clear, there are two causes of this issue, poor budgeting by Americans, lack of proper financial education and disappointing wages. The shocking headlines didn’t include the fact that this stat has been improving in the past few years. As you can see from the Federal Reserve chart on the left, the percentage of people who would cover a $400 expense using cash or cash equivalents (which would be a credit card with no balance that is paid off at the end of the month) is up 9% from 2013 to 2017. The situation is gradually improving.
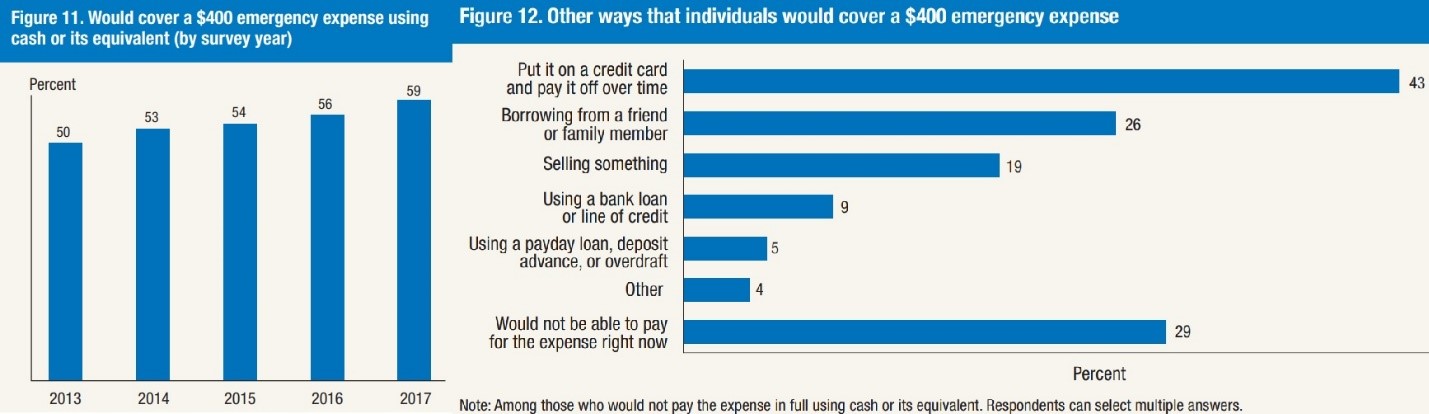
The chart on the right shows how the people who wouldn’t use cash would pay for the $400 expense. The most common answer is a credit card paid over time. Clearly, that’s not a great choice as credit cards have a high interest rate. That only perpetuates the problem of not having enough cash. It’s easy to get into credit card debt and extremely difficult to get out of it. Humans are creatures of habit which makes it difficult to start saving more by cutting back on discretionary spending. Being in credit card debt is like living your life underwater and not being able to breath. The scariest part of this chart is that 29% said they simply wouldn’t be able to pay that expense. They are so indebted and have such little discretionary income, there’s no room to pay for or borrow $400. Americans need to be better educated in personal finance.
Economy Improving Slowly
The reason we criticized the headlines about this report is because the takeaway if you have been following the economy for the past few years, is that the economy is showing improvements. Most data points got healthier. Only if you never reviewed the data would you think it is surprising. The chart below is one of the metrics which showed improvement in this report. The question is whether respondents are at least doing okay financially.
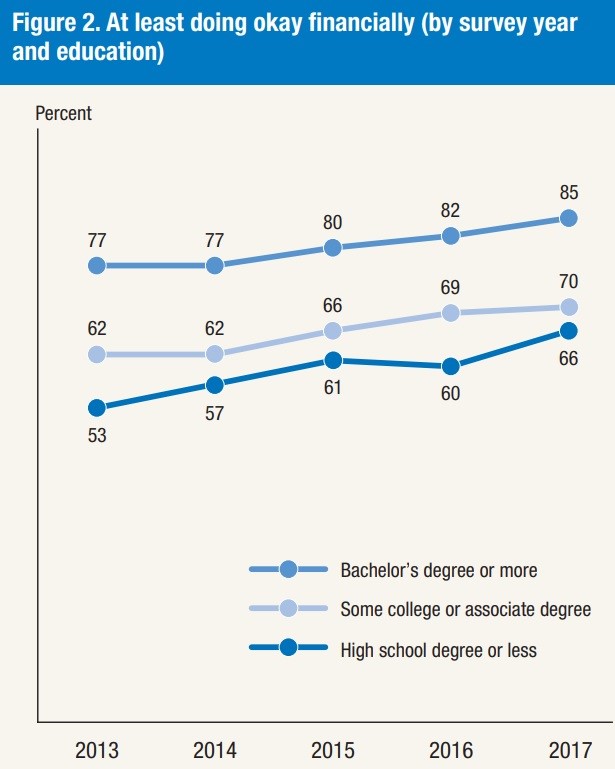
85% of people with a Bachelor’s degree or more are doing okay. Younger millennials who just graduated and still have excessive student loan debt are probably the majority of the 15% who aren’t doing well. This is an 8% improvement since 2013. Those with a college degree are the least susceptible to swings in economic performance. The 2008 recession was severe, so even they were hit hard. Those with some college education improved 8% in the past 5 years to 70%.
Those with a high school degree or less are the most sensitive to swings in the economy. This stat went from 53% of people saying they were doing okay in 2013 to 66% saying they were doing okay in 2017. The gap between college graduates and high school graduates has shrunk from 24% to 19% as the economy has improved. If a media outlet claims the economy is doing poorly because the amount of people who say they are doing okay is low, they are taking the data out of context. Context is the most important aspect of studying surveys because it is the only way to understand the data. The way questions are asked determines results; therefore, the best way to analyze results is to compare the answers from the same question over time.
Consumers Have Deleveraged
On the one hand, the consumer has deleveraged since the financial crisis as housing debt is $9.38 trillion as of Q1 2018 which is below the peak of $9.99 trillion in Q3 2008. That’s significantly down when you take into account wage growth, population growth and inflation. On the other hand, the 2017 Fed report suggests that the consumer is far from ready to get back to the leverage seen at the peak of the last cycle. That level of leverage probably will never be repeated because housing is the only aspect which can drive leverage that high and the mistakes aren’t going to be repeated as easily, given that lending standards have improved.
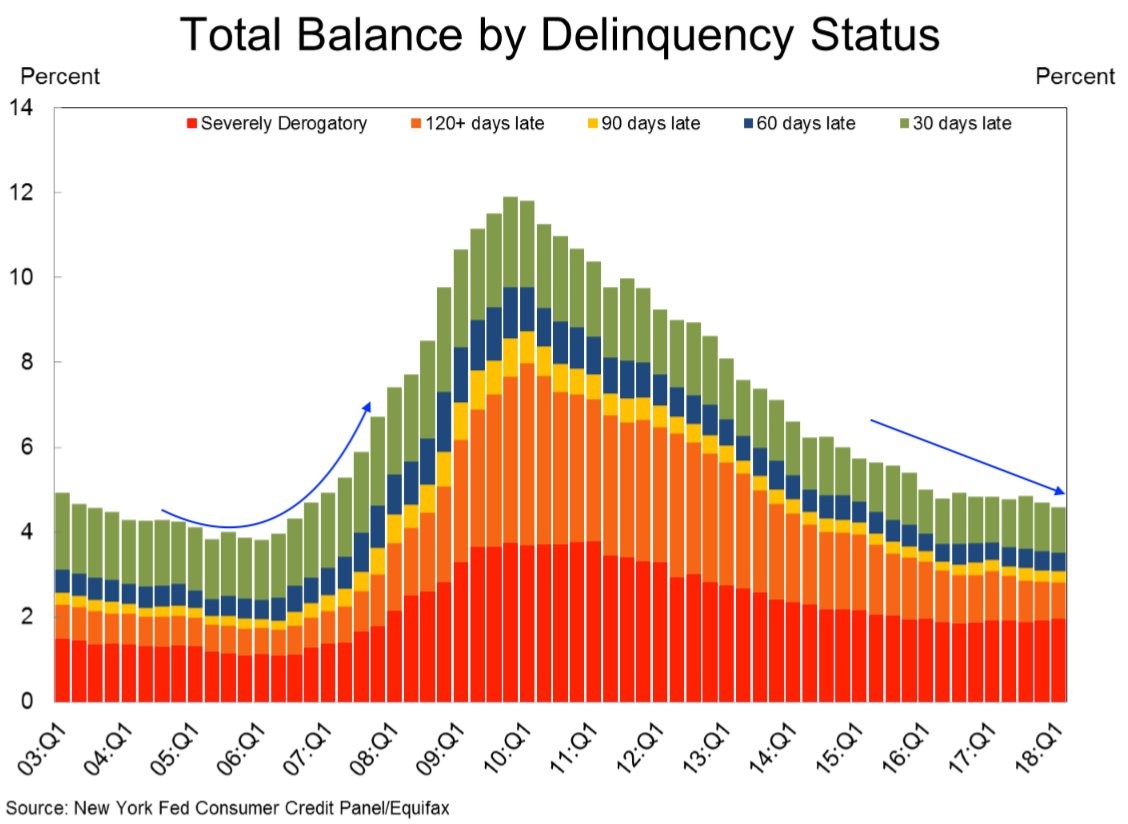
The chart below shows the good news from the NY Fed’s Q1 Household Debt and Credit Report. The total balance of delinquent loans has continued to fall.
The 90+ day delinquency rate of student loans improved from 11% last quarter to 10.7% this quarter. That’s the lowest rate since Q2 2012. On the other hand, the delinquency rate of auto loans increased from 4.1% to 4.3% which was the highest rate since Q3 2012.
Conclusion
On all fronts, the consumer is improving as the percentage of those who have $400 cash to pay for unexpected expenses is up, the percentage who say they are doing okay financially is up, and the total percentage of delinquent loans is down. The economy isn’t doing well for everyone, but there has been progress made and the direction is positive. The shocking aspect is how bad the economy got in 2008, not how bad it is now. It’s very obvious to our readers that the unemployment rate is a flawed indicator that even though suggests nothing could be better with the economy, clearly overlooks the fact that savings in America continues to be a struggle. The same could be said about the the all-time high US stock market as we pointed out in a previous article: 50% Of Households Own No Stocks.
Have comments? Join the conversation on Twitter.
Disclaimer: The content on this site is for general informational and entertainment purposes only and should not be construed as financial advice. You agree that any decision you make will be based upon an independent investigation by a certified professional. Please read full disclaimer and privacy policy before reading any of our content.


