UPFINA's Mission: The pursuit of truth in finance and economics to form an unbiased view of current events in order to understand human action, its causes and effects. Read about us and our mission here.
Reading Time: 4 minutes
The May JOLTS report was a mixed bag. There were some sequential and even yearly declines, but openings and hirings are still elevated. The worst thing an indicator can do is go from great to good. However, since reports can be volatile and revised, it’s incorrect to become bearish because of one data point. The number of job openings is still above the number of people looking for work. The labor market is relatively full.
Big Decline In Hiring After It Hits A Record High
There were 7.323 million job openings in May which missed estimates for 7.4 million. The April reading was revised down from 7.449 million to 7.372 million. Openings were up 2.8% yearly which signals the labor market is in its 3rd slowdown of this expansion. That’s the weakest yearly growth rate since May 2017.
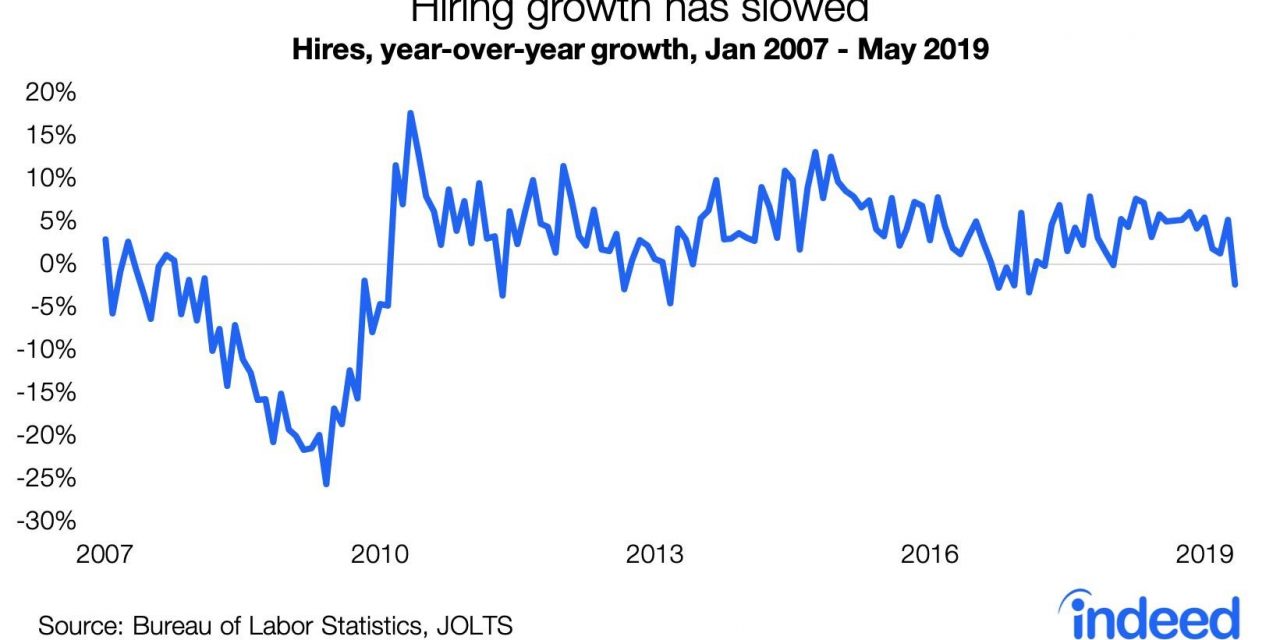
Hiring is the most important facet of this report because without hiring, openings don’t matter. Hiring was both the best and worst part of this report because April hiring was revised much higher and it fell in May. Specifically, the number of hires in April was revised from 5.697 million to 5.991 million which is an all-time record high (report started in December 2000) and a 5.2% increase from last year. This big revision explains why you can’t focus too much on one report. Many investors probably are discounting this figure because it is old data and this report is already a month behind the BLS report. However, there is still something to be said for hiring reaching a cycle high while the Fed is about to cut rates and some are fearing a recession.
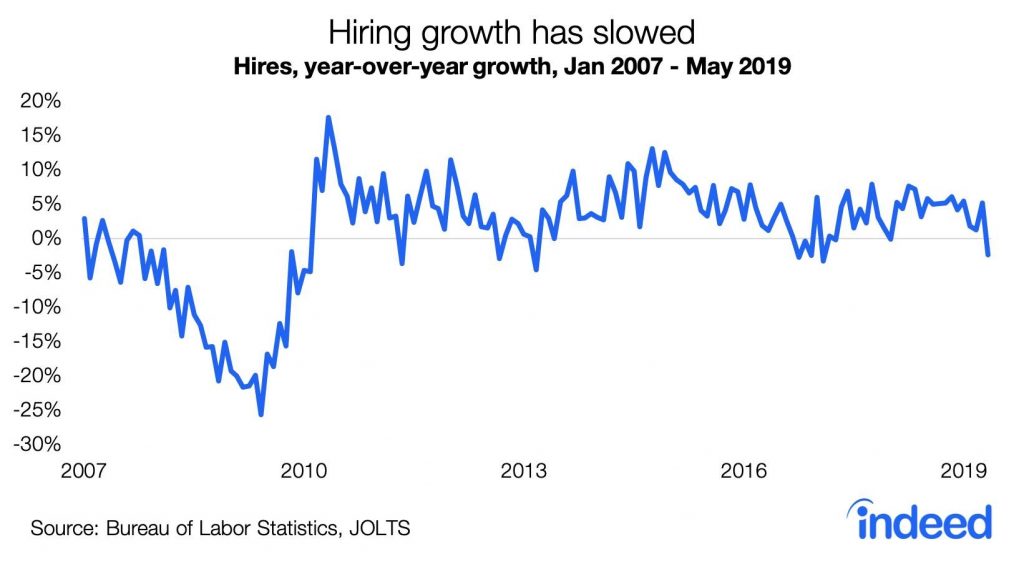
As we mentioned, hiring wasn’t as strong in May as it fell to 5.725 million which is a 2.3% yearly decline. Interestingly, of the previous 9 months with negative yearly growth in this expansion, 7 were followed by positive growth readings. That could mean growth will improve in June, or maybe May’s reading will be revised higher.
The quits rate stayed at 2.3% which is this cycle’s high and is just below the record high of 2.5% in January 2001. The number of quits fell slightly from 3.516 million to 3.425 million. There were about 2 quits for every 1 layoff or discharge. That means about 2/3rds of the time a worker left, it was voluntarily. This is good to see as it means the labor market is giving people confidence to leave their job and find a new one. The quits rate at state and local education jobs hit 1% which is a record high. The healthcare and social assistance group has the tightest labor market as there were about 2.5 job openings for every unemployed worker.
Modest Decline In NFIB Small Business Index
Just like the JOLTS report, there was some sequential weakness in the NFIB small business confidence index, but it was still very strong. Specifically, the index fell from 105 to 103.3 which missed estimates for 104. The most important aspect of this report is that uncertainty rose to the highest level since March 2017. As you can see from the chart below, it is the 4th highest reading ever. We aren’t sure why there seems to be a secular increase in uncertainty, but the recent spike is probably because of trade. Uncertainty might drop in July when small businesses see that America and China are negotiating (supposedly) a trade deal.
6 of the 10 indexes in this report fell. Since inventories increasing is a negative, there were 7 bad readings and 2 good ones. The net small businesses expecting real sales to be higher fell 6 points to 17%. The net expecting positive earnings trends fell 6 points to -7%. The net saying now is a good time to expand also fell 6 points to 34%. The biggest positive in this report is that the net expecting credit conditions to improve in the next 3 months increased 2 points to -3%. The availability of loans index was up 2 points to -2% as you can see from the chart below.
This is tied for the highest reading of this cycle and 2 points away from the highest reading ever (going back to 1986). It’s weird to see the Fed considering cutting rates when credit is highly available to small businesses.
Recession Warning?
Housing certainly isn’t strong as real residential investment growth has been negative for 5 straight quarters (although it’s predicted to be positive in Q2). Our question is how weak can housing starts get if this cycle barely even saw much of an increase? It’s like the effect losing one game would have on a last place team’s place in the standings.
On the negative side, single family new home sales peaked in November 2017. If a new peak isn’t reached soon, this will quickly become a recession warning. The fact that the housing market isn’t incredibly strong given the low unemployment rate, low mortgage rates, and positive real earnings growth shows how unaffordable housing became in 2018.
The slide below from Pictet Asset Management shows 75% of the time when residential fixed investment has turned negative there has been a recession. That includes 12 events. As the table shows, the average stock market return is -4.6% after 3 months which is 6.6% less than the average of all 3 month periods.
NY Fed Predicts A Recession
The NY Fed’s recession indicator is the treasury spread. You can figure out if the treasury market is predicting a recession yourself without waiting for this index to be updated every month. However, we are covering it because it has been popular in the news.
Since the late 1950s, there has only not been a recession when this indicator has signaled this high of a recessionary forecast once. There is a reason this indicator rarely gets above 50%. That’s because recessions are dynamic. Even when the economy is in one, it isn’t a certainty in real time. Anyone who claims this indicator guarantees a recession soon isn’t reading it correctly. However, we are watching the 10 year 2 year spread because the expectation for fewer rate cuts this year has shrunken it. The cycle low is 9 basis points in December.
Conclusion
There were sequential declines in job openings and small business confidence. However, that doesn’t signal a recession is coming like what some claim the NY Fed’s calculation is showing. A recession in the next 12 months is far from a lock, but the weakness in residential fixed investment is something to monitor closely. If the Fed moves hawkishly, it could invert the 10 year 2 year spread. Why cut rates when financial conditions already make it very easy for small businesses to get loans?
Have comments? Join the conversation on Twitter.
Disclaimer: The content on this site is for general informational and entertainment purposes only and should not be construed as financial advice. You agree that any decision you make will be based upon an independent investigation by a certified professional. Please read full disclaimer and privacy policy before reading any of our content.


