UPFINA's Mission: The pursuit of truth in finance and economics to form an unbiased view of current events in order to understand human action, its causes and effects. Read about us and our mission here.
Reading Time: 5 minutes
Fund flow is a technical indicator where the average of the high, close, and low is multiplied by trading volumes. A positive flow occurs when a stock is purchased at an uptick and a negative flow occurs when it is bought on a downtick. The theory is this metric measures the excess demand for securities.
Fund Flows Are Bad
As you can see from the chart below, there is a record disconnect between global flows and global equity returns. Maybe this shouldn’t come as a shock to investors because the June Bank of America fund manager survey showed investors were pessimistic.
Following the disconnect in 2016, stocks rallied in 2017. There needs to be more to your bearish thesis than just flows, but it’s interesting to watch. As an addendum, European equities are seeing their longest stretch of outflows in a decade. This isn’t just an American driven shift.
Multiple Expansion Popular In 2019
In 2019, multiple expansion has driven most of the S&P 500’s returns. In the chart below, if you look at all the bars dating back to 1999, the current one actually looks the most like 2009.
Even though the drop in Q4 2018 wasn’t as bad as the decline in 2008, it was significant considering it pushed returns negative in a year with very solid earnings growth. Because stocks fell while earnings grew, there was a large multiple contraction. A lot of the multiple expansion this year is make up for last year. Many investors selling stocks into the trough in 2018 were betting on a recession. That’s the only rational explanation for such a multiple contraction. This year is much different from 2009 because 2009’s returns were making up for the fact that investors selling stocks in 2008 were pricing in the continuation of unsustainably low earnings.
Yes, Stocks Were Cheap Late In 2018
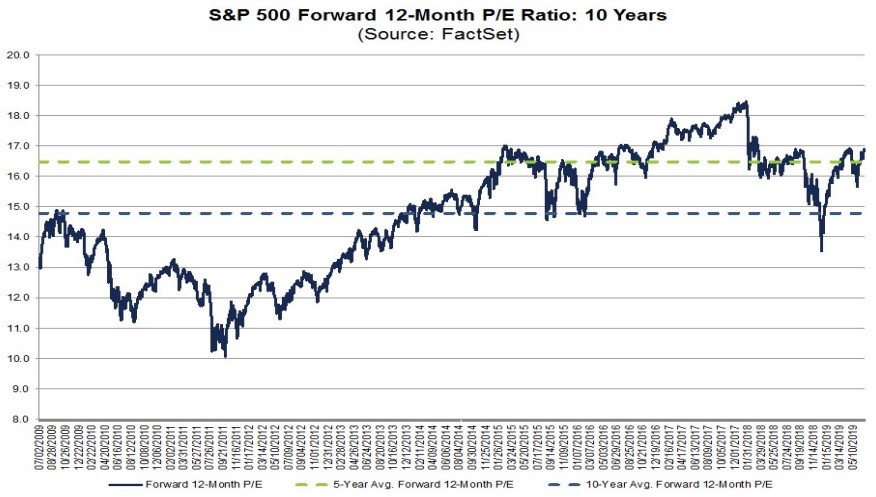
Many bears won’t admit it, but stocks got cheap in late 2018. Earnings estimates couldn’t keep up with the decline in stocks late last year, so the revisions came early this year. That wasn’t a bother for investors as they were ready for another year without a recession. As you can see from the chart below, the 12 month forward PE ratio of the S&P 500 fell below the 5 year and 10 year average late last year.
One of the most confusing aspects of this rally for some investors is that stocks have rallied into a slowdown. Obviously, a 20% decline isn’t justified if this is a slowdown instead of a recession, but these investors assumed there should be some decline in stocks during a slowdown rather than new record highs. Economic slowdowns make corrections more prevalent, but they don’t always prevent gains. Also, keep in mind, stocks haven’t done much in the past 18 months. The S&P 500 is only up 3.59% since January 26th, 2018.
Monetary & Trade Policy
The two factors in play that affect most macro outlooks are monetary policy and trade policy. The Fed’s small rate cuts in 2019 will only work if this is just a slowdown. The question is what if anything can a rate cut do when financial conditions are calm? The catch 22 is conditions might be calm because the Fed is expected to cut rates. Trade policy has a big impact on business sentiment readings such as the ISM and Markit PMIs. We think the stock market doesn’t necessarily need a trade deal; it just needs more certainty which means tensions not rising. Indefinite negotiations with a potential for the tariffs to be rescinded would be a positive for stocks. They have rallied during the ‘status quo’ period for trade for years. The feared impact of tariffs is more than the actual impact according to many firms’ management teams.
Where Will 2020 Earnings Come In At?
The biggest determination of the S&P 500’s performance in 2020 will be if earnings estimates are hit. That might seem like a farce to some skeptical investors because stocks have rallied on weak earnings growth in 2019 as there has been a lot of multiple expansion. However, unless stocks fall sharply between now and the end of the year, stocks will start 2020 more expensive than they started 2019. Instead of following a year with severe multiple compression, 2020 will follow multiple expansion.
The chart below explains why 2020 earnings estimates are important.
If earnings estimates are reached, the S&P 500’s operating PE ratio eventually drops to 16.2. If investors gain confidence in those estimates over the next 12 months, stocks will rise. The multiple is low because investors aren’t confident in them. If earnings growth comes close to meeting estimates, stocks will look cheap at current prices. If earnings don’t grow, the multiple will be just as high as it is now.
2020 Expectations
Earnings growth estimates start at somewhere around 10% before economic data and guidance come out. That explains the left hand side of the chart below. Those estimates were on autopilot. Since then, 2019 estimates cratered because of the anticipated economic slowdown.
2020 estimates actually rallied in early 2019 when analysts realized their comparisons would be easier. Comps help if growth is near the long term trend, but if the weakness leaks into 2020, there will be big negative revisions to 2020 estimates. Unlike this year, stocks probably won’t rally if earnings growth is low.
Quarter By Quarter
When earnings season gets going next week with the big banks reporting, we will be laser focused on how the results affect Q3 estimates. That tells you if the quarter was good. Q4 will be the start of 2020 in a sense because it faces easier comps like 2020. It is expected to have near trend growth like the rest of 2020. It will be a leading indicator for next year. Stocks usually can rally while earnings estimates decline, but the situation is tougher when stocks are fully priced. Obviously, it matters where estimates started at and how much they fall. If you go far enough in advance, the estimates will usually be about 10%. That’s what Q2 2020 might represent.
Conclusion
We will be following Q2 earnings season closely. So far, 71% of the first 21 firms to report saw their Q3 estimates fall. Q2 earnings growth is expected to be slightly negative, but it will end positively. The first 22 firms to report have had earnings growth of 4.67%. The final result doesn’t matter much as investors are already starting to look towards next year. Q4 earnings growth is supposed to be the peak for the year. We will start looking at the rate of change of those estimates after this earnings season comes close to ending in August. Saying stocks are fully priced isn’t as sexy as calling for a recession like was feared late last year. However, limited potential upside can be similarly bearish.
Have comments? Join the conversation on Twitter.
Disclaimer: The content on this site is for general informational and entertainment purposes only and should not be construed as financial advice. You agree that any decision you make will be based upon an independent investigation by a certified professional. Please read full disclaimer and privacy policy before reading any of our content.


