UPFINA's Mission: The pursuit of truth in finance and economics to form an unbiased view of current events in order to understand human action, its causes and effects. Read about us and our mission here.
Reading Time: 5 minutes
The June Conference Board consumer confidence report is an example of a report going from great to good. The consumer confidence index fell to its lowest level since September 2017, which actually doesn’t sound terrible as the economy was doing fine then. However, what does sound bad is this monthly decline is the 5th worst since the financial crisis. The only worse declines were in October 2008, February 2009, February 2010, and August 2011.
Conference Board Index Declines
The decline in June was catalyzed by worries about the trade war. It makes sense confidence fell because the latest round of tariffs had a much bigger impact on consumer goods than the prior rounds. The big monthly decline was made worse by the negative May revision. The index declined from 134.1 to 131.3. In June it fell to 121.5 which missed the consensus of 132 and the low end of the consensus range which was 128.8.
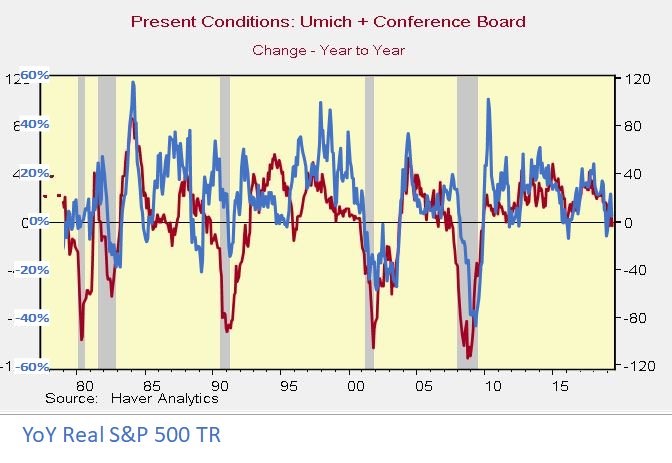
The present index fell from 170.7 to 162.6 and the expectations index fell from 105 to 94.1. To be clear, the Conference Board index is further off its cycle high than the University of Michigan survey and the Bloomberg Consumer Comfort survey. The weakness in the Conference Board survey was driven by a less favorable measurement of the business environment and the labor market. We will get into some of the details later on, but let’s not pretend that confidence isn’t driven by the stock market. As you can see from the chart below, in the past 2 cycles, the yearly change in present conditions is highly correlated with the yearly total return in the S&P 500.
With the internet, it’s easier than ever for consumers to check their portfolio’s returns.
Weakness In The Labor Market
Some economists believe the only valuable information from consumer sentiment readings is the consumer’s opinion on the labor market. The consumer’s opinion on the economy might be flippant and might not relate to actual spending. However, the consumer’s confidence in the labor market is directly related to spending and is something the consumer has first hand knowledge of. The consumer’s opinion on the labor market in this report showed cracks. Those saying jobs are plentiful fell from 45.3% to 44%.
Those saying jobs are hard to get increased from 11.8% to 16.4%. That’s a sharp increase. As you can see from the table below, previous increases similar to this amount were all during recession. However, this data doesn’t show what the rates increased to, so it doesn’t mean the economy is in a recession now. This report was still good. It’s just awful in rate of change terms which makes some fear worse data is coming.
The differential of jobs plentiful versus jobs hard to get fell 5.9% which was the worst reading in 12 months (not terrible), but the biggest decline since February 2009. Finally, the percentage of consumers expecting more jobs to become available in the next few months fell from 18.4% to 17.3% and those expecting fewer jobs increased from 13% to 14.8%.
Low Vol Roars Higher
In early 2018, the short volatility trade blew up after being widely popular. The new popular trade is going long low volatility stocks. To be clear, this a more risk averse trade than shorting the VIX. As you can see from the chart below, the low vol index has the highest percentage of stocks trading above their 150 day moving average since 2013.
It’s not a surprise these stocks are doing well because the utilities sector has had a great year. The XLU ETF is up 16.59% year to date. This sector loves the decline in treasury yields and the worries about economic growth.
On a related note, consumer staples stocks have never lost money in any 5 year period since 1977. Also, the number of stocks with greater than 19% sales growth has fallen since 2000. At the peak in the early 2000s, there were over 200 such stocks and now there are under 100.
Okay Richmond Fed Manufacturing Report
The June Richmond Fed manufacturing report wasn’t as bad as the other regional Fed manufacturing reports. Its weakness was located in the expectations portion like the Dallas Fed report. Unlike the general business conditions indexes in other regional Fed reports, the Richmond Fed’s index is a composite as it includes data on shipments, new orders, and employment. Specifically, it fell from 5 to 3. The shipments index was up from 2 to 7. The volume of new orders index was up from 0 to 1. Finally, the measurement of local business conditions was up from 2 to 8. Much has been made about the expectations index for local business conditions being at a record low as it fell from 22 to 10, but few mention the current index’s improvement. 9 of the 11 expectation indexes fell. However, 2 of those declines were in inventories, so it’s not a complete disaster.
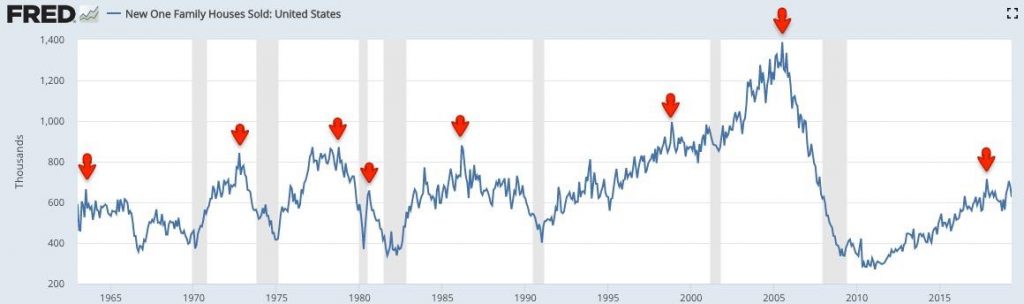
Weak New Home Sales
The May new home sales report was bad and a negative revision to March report made it so that the cycle high is now November 2017. The median lag time from the cycle peak to the next recession is 28 months. If that peak holds and this cycle has the median lag time, the next recession will start in March 2020. May’s sales fell from 679,000 to 626,000, missing estimates for 680,000. The 3 month average fell 14,000 to 670,000; that was its first decline of the year. Median new home prices fell 8.1% monthly and 2.7% yearly to $308,000. New home sales in the West fell from 195,000 to 125,000. They fell from 34,000 to 28,000 in the Northeast. On the other hand, they increased 5,000 to 84,000 in the Midwest. This data is all about the South as it dominates this calculation. Sales in the South increased from 371,000 to 389,000. Monthly supply increased from 5.9 months to 6.4 months.
Conclusion
We had 2 recession signals come from recent data. The percentage of consumers saying jobs are hard to get increased sharply and the new home sales peak is once again November 2017. However, the differential between the percentage saying jobs are plentiful and the percentage saying jobs are hard to get is only the weakest in 12 months. It’s not like the labor market was dreadful last year. Also, new home sales are still above their bottom late last year. The lowest reading was 557,000 in October.
Have comments? Join the conversation on Twitter.
Disclaimer: The content on this site is for general informational and entertainment purposes only and should not be construed as financial advice. You agree that any decision you make will be based upon an independent investigation by a certified professional. Please read full disclaimer and privacy policy before reading any of our content.


