UPFINA's Mission: The pursuit of truth in finance and economics to form an unbiased view of current events in order to understand human action, its causes and effects. Read about us and our mission here.
Reading Time: 5 minutes
In this article we will review a couple of dynamic changes in the market and one myth which needs to be busted. One of the most important questions on Wall Street is if correlated metrics have a causal relationship. Even when relationships have been correlated for years, that doesn’t mean the relationship is causal; it could be circumstantial. This is also related to myth busting, but with a twist. The correlations you see in charts may not exist as the tricky use of data and the formatting of charts can fool readers into thinking a correlation exists when it doesn’t. We’ll also be reviewing the machine that is the financial markets. There’s a bias to the upside as the banks want their clients to succeed. The market battles back as short sellers are incentivized to break through the facade to get at the truth and spread the word to change how the markets price a security.
The Earnings Game
Earnings season can be a farce if the historical trends are met. As you can see from the Daily Shot chart, the historical trend shows the earnings estimates are lowered over 3% from 64 days prior to the start of earnings season until earnings season begins.

Source: Daily Shot
The end result of the earnings season is growth slightly above the initial estimates made 64 days before earnings season. However, the growth looks amazing in the headlines as it is 4-5% better than expected. To be clear, there are economic events and special circumstances which cause analysts to change their estimates prior to the results being released, but the main cause of this lowering of expectations is to help companies more easily beat results which is supposed to boost their valuation. Q1 2018 was unlike the historical trend as the estimates were raised prior to the earnings season because of the tax cut. Then the raised bar was beaten which made this quarter even better. The tax cuts and decent economy allowed the earnings game to be avoided.
With 93% of firms reporting, 78% of S&P 500 firms beat their estimates. That’s the highest since FactSet began calculating the results in Q3 2008. The chart below from Bank of America goes further back showing the beat rate is the highest since at least Q1 1994.
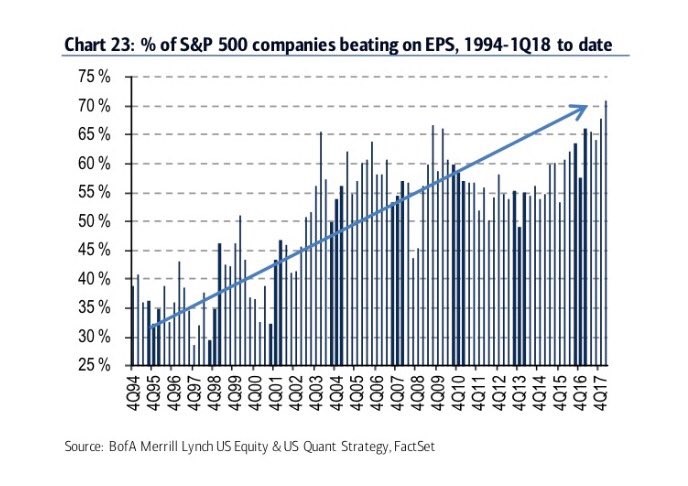
Source: Bank of America Merrill Lynch
The earnings game got started in the early 2000s as firms realized if they do whatever it takes to under promise and over deliver, they could help their stock price move up. Earnings beats have become less relevant as only the algorithms could be fooled by phony beats. Over 40% of firms beat earnings results in 2008 which was the greatest financial crisis since the Great Depression. If the earnings estimates from 64 days before the quarter were used instead of the lowered estimates, the beat rates in the past few years would be much closer to 50% which is where they should be.
There are a few important criteria you can look out for to avoid being tricked into thinking a firm had a good quarter just because it beat on EPS. The easiest thing to look at is year over year earnings and revenue growth. If the firm is in decline, excluding one time effects, beating estimates doesn’t look as appealing. The most important factor to look at is the earnings estimate history leading up to the report. If the stock rallied as earnings estimates fell and then rallied when the lowered estimates were beaten, that’s a big red flag which signals you should be extra careful when determining if value exceeds the price you are paying for the stock. Another factor you should look at is the effect the earnings report has on future estimates. The best reports are ones which beat estimates and raise guidance. Increasing earnings estimates means the results actually did beat estimates in reality and not just a one-time gimmick. Speaking of reality, you can look up the Earnings Whisper number and the Estimize projections to see better estimates which reflect what the market has priced in.
Margin Debt Myth
The myth we’re busting is that high margin debt means stocks are in a bubble and must be avoided.
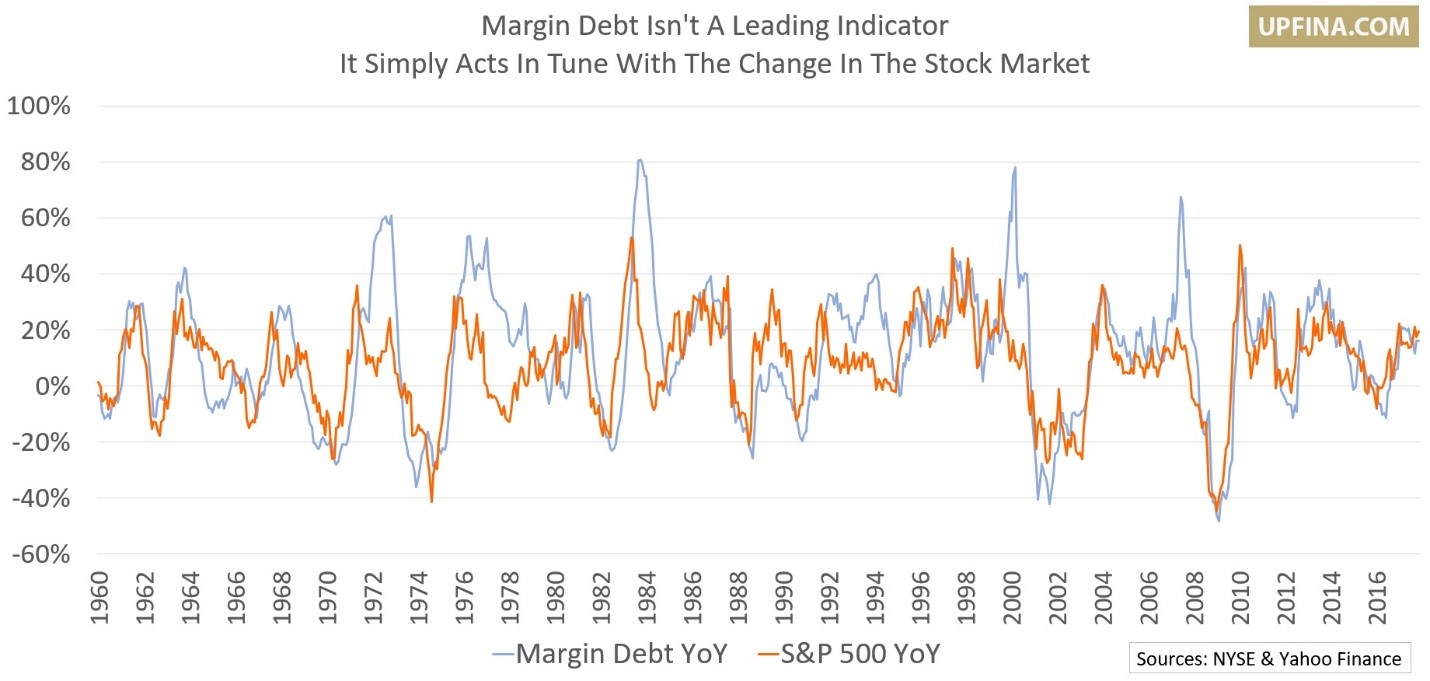
Margin Debt Not A Leading Indicator
The theory is that excessive leverage means the stock market is on shaky ground. It hearkens back to the 1920s when speculators bought stocks on margin which led to the 1930s bear market. However, you can’t make investing decisions based on the fear of high margin debt or the solace low margin debt might provide you because the year over year change in the S&P 500 looks just like the year over year change in margin debt as the two have a 61% correlation. An indicator that acts coincidentally with the market cannot be a leading indicator which helps you predict where the market will go. Fear of high margin debt is a mistake since it’s related to the bull market length and size.
Dollar Correlation To The Deficit?
In theory the budget deficit is correlated to the stock market and the currency. As you can see from the Bloomberg chart below, in the past high budget deficits resulted in a weak dollar, and a weak stock market returns when adjusted for inflation.
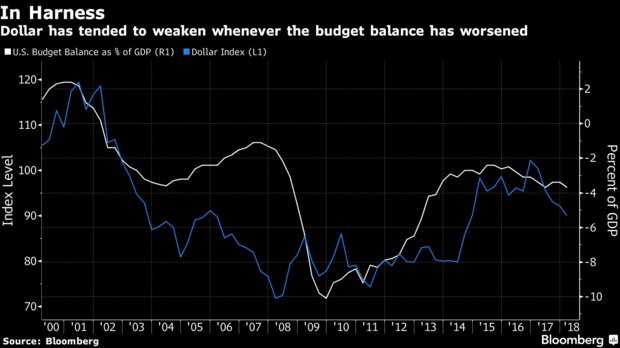
Source: Bloomberg
However, it’s very likely the stock market follows the economy and it’s possible the dollar does to. Budget deficits historically have increased when the economy weakens. We’re seeing a decoupling of that trend as the omnibus spending deal and the tax cut boost deficits and growth. We’ve seen the dollar and U.S. stock market rise, even as the deficit has increased in 2018, because the economy has done well. This cycle will tell us the truth about whether the budget deficit matters to the markets.
Conclusion
If the earnings beat rate keeps growing, it will get to close to 100%. We could also see a scenario where the beat rate is above 50% during a recession. In a recession, the market would fall along with the estimates, unlike what has occurred curing this expansion. Before deciding to sell stocks on the basis that the margin debt rate appears scary, examine all factors. No one variable controls market outcomes. Finally, the stock market and the dollar might be more correlated with the economy than the budget deficit since there are multiple factors that impact the dollar given that it is a reserve currency. The economy and the deficit size are decoupling because of the plan to cut taxes and raise spending at the end of an elongated economic expansion.
Have comments? Join the conversation on Twitter.
Disclaimer: The content on this site is for general informational and entertainment purposes only and should not be construed as financial advice. You agree that any decision you make will be based upon an independent investigation by a certified professional. Please read full disclaimer and privacy policy before reading any of our content.


