UPFINA's Mission: The pursuit of truth in finance and economics to form an unbiased view of current events in order to understand human action, its causes and effects. Read about us and our mission here.
Reading Time: 4 minutes
The 2008 financial crisis was pivotal in the economic history of America, not only because it was large and almost toppled the nation’s financial system, but also because it catalyzed a deleveraging. Investors often refer to a deleveraging as a cleansing of the economic system because when debt is recklessly created, some of it is toxic which can’t be paid back. There can either be a “beautiful” deleveraging or an “ugly” deleveraging. This business cycle had both.
The heightened default rates on houses in 2008 caused people to take out less mortgage debt. Nothing forces you to stop spending money like the fear of losing your house. Plus, if a foreclosure occurs, that debt isn’t paid anymore by the borrower. However, there has also been a pleasant deleveraging after the recession was over because lending standards were increased and people began to fear buying houses they couldn’t afford because of the recent collapse. Buying the biggest house possible because housing is a great investment went from being popular to foolish very quickly.
Housing Caused The First Deleveraging In Over 60 Years
Housing is responsible for about 70% of household debt, which means reform to the house buying process is a de facto improvement to household’s budgets. Credit card debt, student loans, and auto loans have all hit records highs this cycle, but household leverage is still down because of the decline in housing debt in relation to inflation.
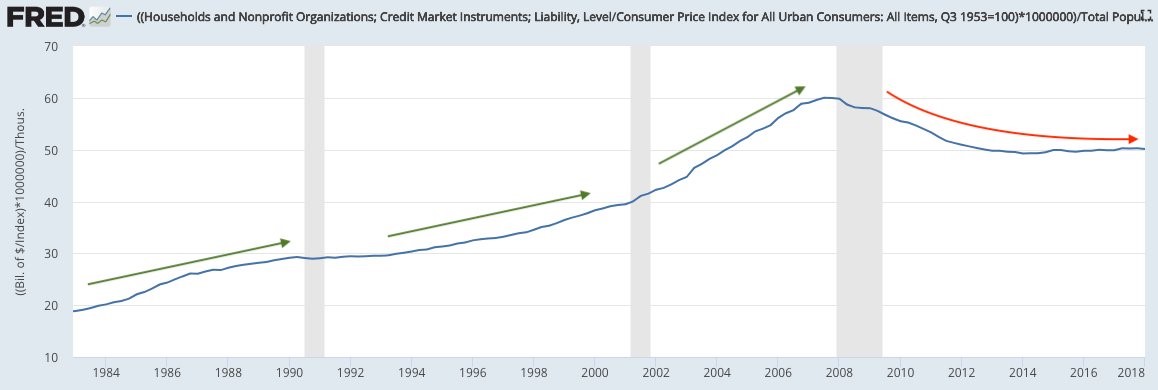
The chart below shows the point we made earlier about how this was a unique deleveraging moment in economic history.

Source: FRED
The household debt divided by the consumer price index fell even during this expansion. Besides the period right after the 1980 recession which led to what some consider a double dip recession in 1982, every expansion since the early 1950s saw consumer leverage expand. Leverage expanded quite rapidly in the 2000s expansion as the leverage ratio was up about 50%, increasing from approximately 40% to 60%.
This current expansion is beautiful (largely) because its being driven by consumers growing their incomes rather than taking out debt at an accelerated rate. The savings rate may be down, but that hasn’t equated to more leverage. Another example of this deleveraging is the decline in household debt to GDP. At the peak in Q1 2008, the household debt to GDP was 99%. As of Q4 2016, it was 80%.
Student Loans Matter
We should always be in favor of a better economy for everyone, which is why it’s important to focus on problems even in a good economy. The biggest problem is student loans because young Americans are saddled with debt before they establish their career. After credit cards came out, there were forced disclosures about interest rates; credit card companies now show how easy it is to get into debt when customers can’t pay in full monthly. While trying to get young adults to avoid credit card debt, there has been a massive blind spot towards student loans. From the age of 17 to the age of 18, young people go from not being able to make decisions for themselves to being able to borrow six figures for college. It’s easy to claim young adults are now less mature than past generations, but the reality is previous generations didn’t have the ability to take out $100,000 in debt in their teens.
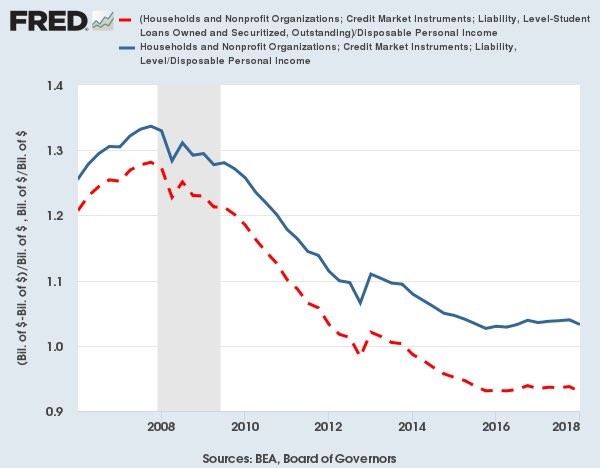
The chart below shows the effect student loans have had on the household debt to disposable income ratio in this cycle.

Source: FRED
There is deleveraging in both lines, but the deleveraging which includes student loan debt (the blue line) isn’t as apparent as the one without student loan debt. Older Americans who can afford homes deleveraged while younger Americans took on more debt. That’s a major generational shift. Keep in mind that it wasn’t easy for Americans who owned homes in 2008 as the economy cratered, meaning many lost their jobs.
An Alternative View Of This Cycle
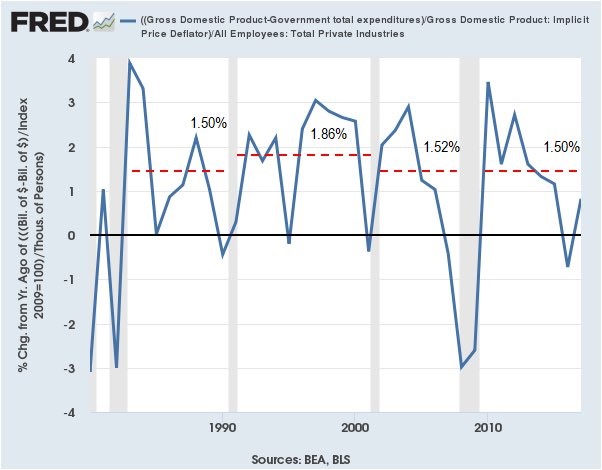
It’s a widely held belief that this cycle has seen slow growth compared to past cycles since GDP growth has been lower. The chart below aims to show that is a misconception. The FRED chart shows the GDP subtracted by government spending divided by GDP adjusted for the change in the number of employees. It looks at the private sector growth adjusted for changes in demographics.

Source: FRED
The average growth rate isn’t significantly below the previous cycles. The accelerating growth in Q2 2018 will only lift this average further. The big factors which change this from the regular GDP measure are demographics and government spending. It’s not fair to ignore demographics because you can’t expect the same economic output from a smaller labor force as a function of baby boomers retiring.
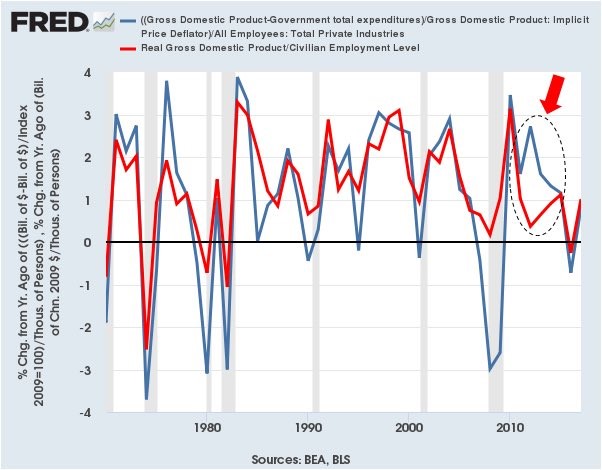
Stronger private sector growth is preferable over public sector growth because the private sector has the resources to employ more people, is the innovative hub of the economy, and usually government spending expands in recessions because it’s when people need more assistance. The chart below points out where the lack of government spending hurt GDP growth by showing GDP growth per worker and GDP growth per worker excluding government spending.

Source: FRED
The private economy was growing from 2011-2015 while the overall economy was dragged down by the government.
Conclusion
Consumers have deleveraged, but that doesn’t mean there won’t be another recession until it picks up again. It means that the consumer is unlikely to face the amount of pain felt in 2008 in the next recession. This economic expansion isn’t as moribund as it seems when you adjust for changes in demographics and changes in government spending. This is an informational article to help you contextualize the economy rather than one which says blue skies are permanently ahead.
Have comments? Join the conversation on Twitter.
Disclaimer: The content on this site is for general informational and entertainment purposes only and should not be construed as financial advice. You agree that any decision you make will be based upon an independent investigation by a certified professional. Please read full disclaimer and privacy policy before reading any of our content.


