UPFINA's Mission: The pursuit of truth in finance and economics to form an unbiased view of current events in order to understand human action, its causes and effects. Read about us and our mission here.
Reading Time: 5 minutes
Everyone wants to know where the stock market and the economy are moving next because that’s what determines the profitability of investments, timing for personal life decisions, business decisions such as investing in CAPEX or acquisitions and how governments decide to set policy. President Trump recently stated his trade policy can occur because “we’re playing with the bank’s money” since the stock market and the economy are doing well partially because of his tax plan, regulatory reform, and fiscal stimulus. To be clear, rising stock prices help different people than tariffs hurt; the point here is that many decisions are about timing the cycle. It’s a catch 22 because timing can be everything, but it isn’t easy to predict the cycle.
One of the ways investors and economists like to time the cycle is by looking at leading indicators. The most followed indicators already have a good track record and as a result have the advantage of being well known which means they can influence markets along with predicting them. One of the most prominent economic indicators is the yield curve. While the yield curve simply consists of current market bond yields, it simultaneously includes all economic data points because those are the variables used in deciding bond yields.
ECRI Leading Index
One prominent leading indicator is the ECRI leading index which we have mentioned in a few articles. It’s a proprietary measure, so we don’t know exactly what’s inside and what the weightings of each component are. The chart below shows the ECRI index compared to the S&P 500 to show the index’s track record in predicting market movements.
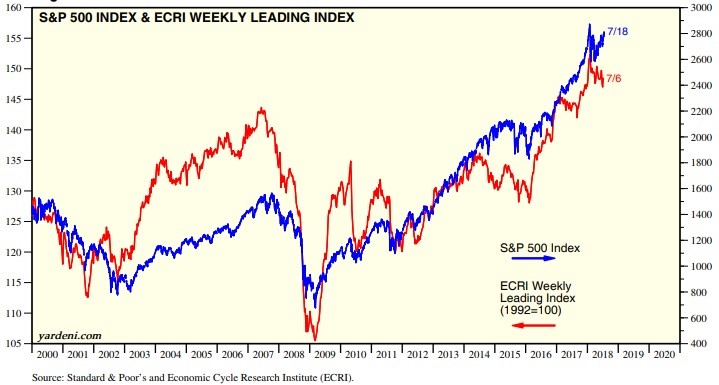
Source: Yardeni Research
The ECRI index peaked and started moving sharply lower in early 2007. That could’ve tipped you off that a recession was coming. It also peaked in early 2014 which signaled a sharp slowdown was coming. The slowdown put the stock market in a holding pattern for a few quarters. The ECRI index was also optimistic in 2003 and 2009, signaling a bull market was coming. You can see that the ECRI leading index has been faltering while the stock market has been rallying in the summer of 2018, but the difference between the two is not yet significant.
The chart below gives you a closer and more updated view of the year over year action in the index.

The year over year growth rate signaled Q2 was going to have great GDP growth since it showed very high growth early in the year. Now growth is plummeting as the latest reading only shows 0.9% growth over last year. This is the weakest growth rate since September 2017. A few more weak readings will support the notion that growth will slow down in the second half of 2018.
One of the key themes ECRI has been promoting to support its index’s findings is the modest weakness in personal income growth and personal spending growth in the past few months. The chart below shows their modest deceleration.
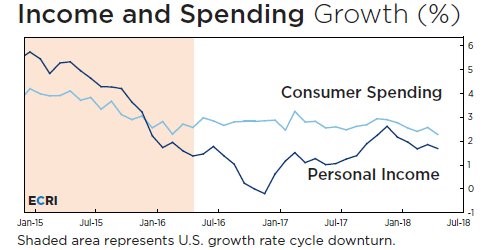
Interestingly, the estimate for real consumer spending growth in Q2 is 2.9% which is over triple the final result in Q1, which was 0.9%. April had a strong PCE report while May’s report wasn’t as great. We will get the June PCE report and the updated May report on July 30th, which will tell us which side is correct in this debate. Keep in mind, this report tells us about income growth, spending growth, and inflation. The year over year core PCE growth is the most followed inflation metric by the Fed.
Conference Board Leading Indicators
Another famous leading index is the Conference Board index. Unlike the ECRI, this one reveals the components. The 10 components are the following: the average work week length, unemployment claims, new orders: consumer goods and materials, ISM New Orders index, new orders: non-defense capital goods excluding aircraft, building permits, the S&P 500, leading credit index, interest rate spread, and average consumer expectations for business conditions.
The chart below shows the leading indicators index reached a record high in June unlike the ECRI report.
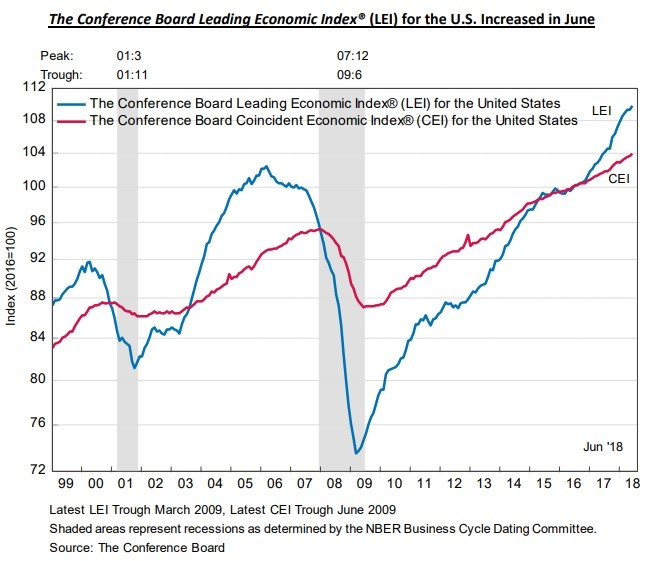
Source: The Conference Board
The leading indicators are ahead of the coincident indicators and do a good job at forecasting economic growth and recessions. The death cross, where the leading indicators index falls below the coincident indicators index, is a great signal of a recession. The golden cross, which is the reverse, is a great signal of economic growth. It was very difficult to analyze this indicator in 2015 and 2016 because the two kept falling above and below one another. No indicator is perfect; many predicted a bigger economic decline and stock market decline than what occurred during that period.
The chart below shows how the year over year leading indicators index has done a great job at forecasting recessions in the past two cycles.
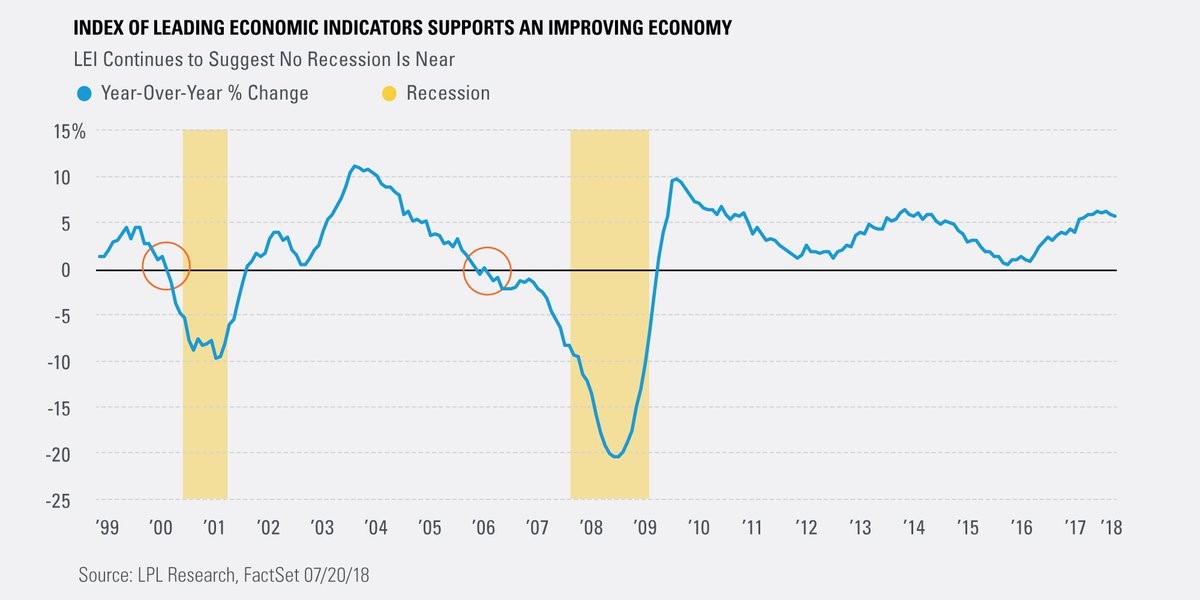
Source: LPL Financial Research
This brings us to two great points when using this indicator. The chart below shows the leading indicators have a great track record of predicting GDP growth.
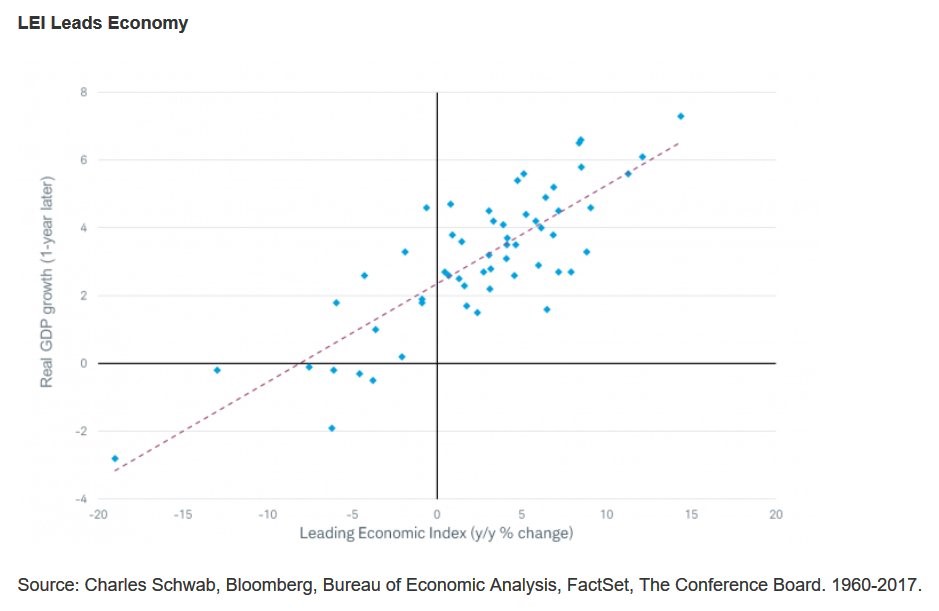
Source: Advisor Perspectives
The correlation between the 12 month change in the leading indicators report and the following year’s GDP growth is 83%. Whenever the leading indicators index has been up, GDP growth has been at least 1.5% since 1960.
Unfortunately for stock investors, the leading index doesn’t predict stock returns as the correlation is actually slightly negative. This shows that the stock market and the economy aren’t always on the same path.
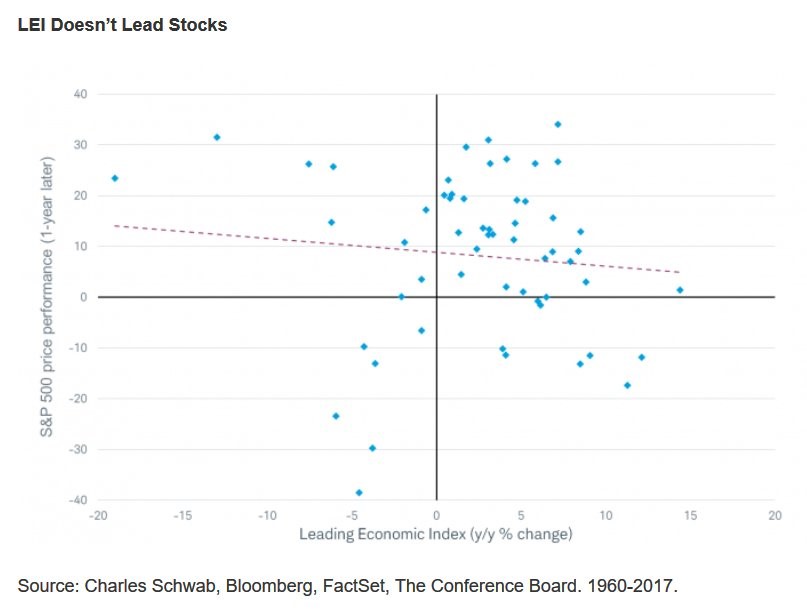
Source: Advisor Perspectives
Conclusion
Everyone wants to know the future. The leading indicators don’t have a crystal ball, but they can be used as a tool to predict economic growth and in the ECRI’s case to forecast stock market returns. The more tools you have, the better chance you have at predicting changes in the business cycle. We show as many tools we can in our articles to help you avoid recessions and prosper in bull markets.
Have comments? Join the conversation on Twitter.
Disclaimer: The content on this site is for general informational and entertainment purposes only and should not be construed as financial advice. You agree that any decision you make will be based upon an independent investigation by a certified professional. Please read full disclaimer and privacy policy before reading any of our content.


