UPFINA's Mission: The pursuit of truth in finance and economics to form an unbiased view of current events in order to understand human action, its causes and effects. Read about us and our mission here.
Reading Time: 4 minutes
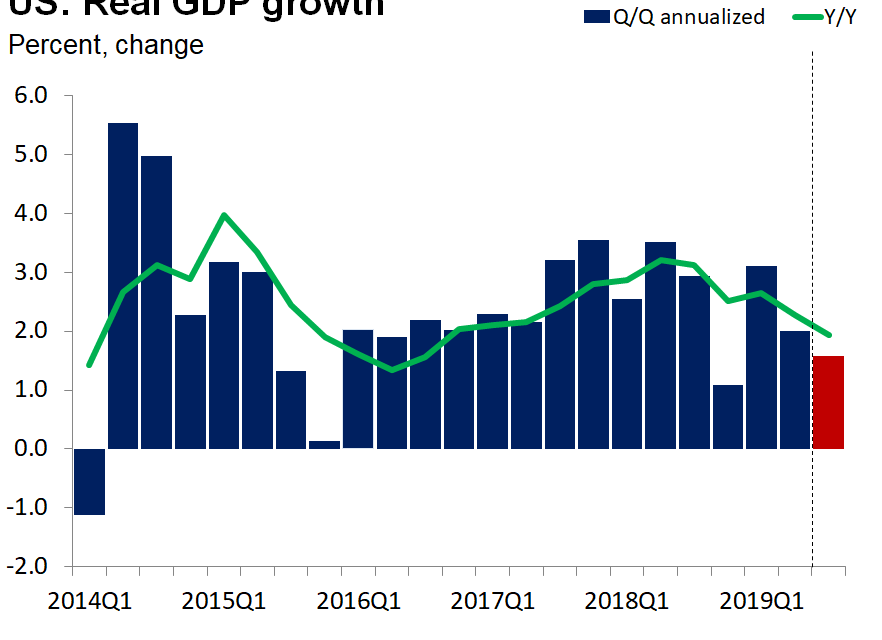
With the recent terrible revisions to older economic data, Q2 GDP’s first revision is a welcome surprise as quarterly headline growth was only pushed lower by 1 tenth to 2% which met estimates. The star of the report became more of a star since quarterly consumption growth was revised up from 4.3% to 4.7%. It added 2.85% to overall real GDP growth. That’s the best impact since Q4 2017. Headline price growth stayed at 2.4% and core price growth was revised lower by 1 tenth to 2.3%.
Government spending growth was still high as it was 4.5%. It helped GDP growth by 0.77%. Non-defense federal spending added 0.4% to GDP growth. Government spending growth was one area not included in real final sales which made the report look better than it was. On the other hand, net exports hurt growth by 0.65% and the change in private inventories hurt growth by 0.86%. Those are big reversals from Q1 which had weak underlying results despite its strong headline growth.
Non-residential fixed investment fell 6.1%. That is in line with the weakness in manufacturing, global growth, the Markit PMIs, and the other negative business sentiment surveys. This category hurt GDP growth by 8 basis points. Residential fixed investment fell for the 6th straight quarter as it was down 2.9%. With the latest decline in interest rates helping the housing market, this streak should end soon. This category hurt growth by 6 basis points. The relatively small impact of these two categories shows how big of an impact consumption has on GDP.
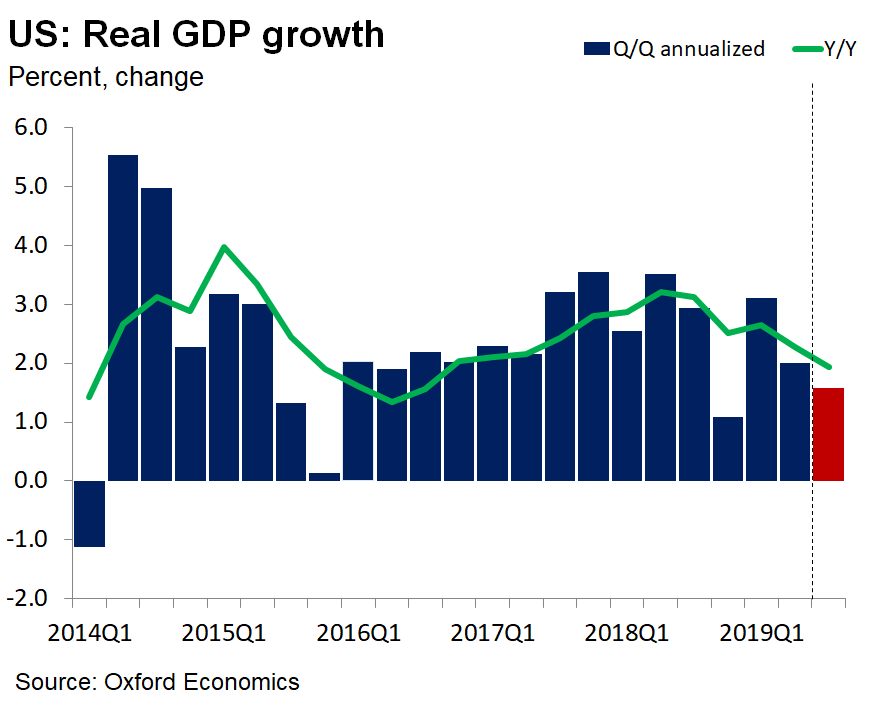
Let’s quickly review yearly growth. As you can see from the chart above, yearly GDP growth was 2.3%. Its recent peak was 3.2% in Q2 2018. The decline in the green line is highly correlated with the decline in long bond yields. Even though consumption growth was strong on a quarterly basis, it’s still off its peak on a yearly basis. Growth was 2.7% which is down from its Q3 2018 peak of 3.4%. Business investment growth was 2.6% which is below its Q2 2018 peak of 6.9%. Residential investment fell 2.6%. Oxford Economics expects yearly Q3 GDP growth to be 2%. That’s exactly the same as the consensus estimate for quarterly growth.
Pending Home Sales Fall: Uptrend Still Intact
It’s a big mistake to look at the July pending home sales report and claim the housing market is in trouble. Look at the trend, not one month of data. The reports since the start of the year have been in an uptrend with a few sequential declines along the way. Specifically, in July the index fell from 108.3 to 105.6. That’s a 2.5% decline which missed estimates for a 0.3% decline. The index is down from 105.9 last year. However, last July it was in a downtrend, while now it’s in the early stages of an uptrend. Pending home sales lead existing home sales by 1-2 months, so expect a weak reading in August or September unless this pending home sales report is revised higher.
The West, which has been seeing solid results from housing reports recently, had the biggest sequential drop in pending home sales. Its index fell 3.4%. Each region saw declines as the Midwest, South, and Northeast had declines of 2.5%, 2.4%, and 1.6%.
Rest of World Global Profits To Fall
Based on the new export orders segment of the ISM report, corporate profit growth from the rest of the world is set to fall. You can see the correlation between the 2 metrics in the chart below.
The strong dollar and global weakness support this estimate. This could be bad for tech earnings which rely the most on the rest of the world. Keep in mind, the regional Fed manufacturing reports imply the manufacturing ISM PMI will improve in August, so this is subject to change. Based on The Earnings Scout’s data, Q3 will be the EPS growth trough in this slowdown as estimates are for growth of -1.07% in Q3 and 6.68% in Q4.
Positive Action On Trade?
The latest round of tariffs is set to go into effect on September 1st. The hope this time is there is a deal at the end of this phase of negotiations. As we have mentioned in a previous article, China has raised tariffs on America and lowered them on the rest of the world. The charts below show the tax rates in various industries.
Autos and parts are about to be hit with a major tariff increase on December 15th.
Capital Gains Taxes Set To Increase If The Democrats Win
No matter which of the top Democratic candidates (Biden, Sanders, & Warren) wins the primary, capital gains taxes will increase if the Democrats also win the Senate. The charts below compare current law with Biden, Warren, and Wyden’s plan.
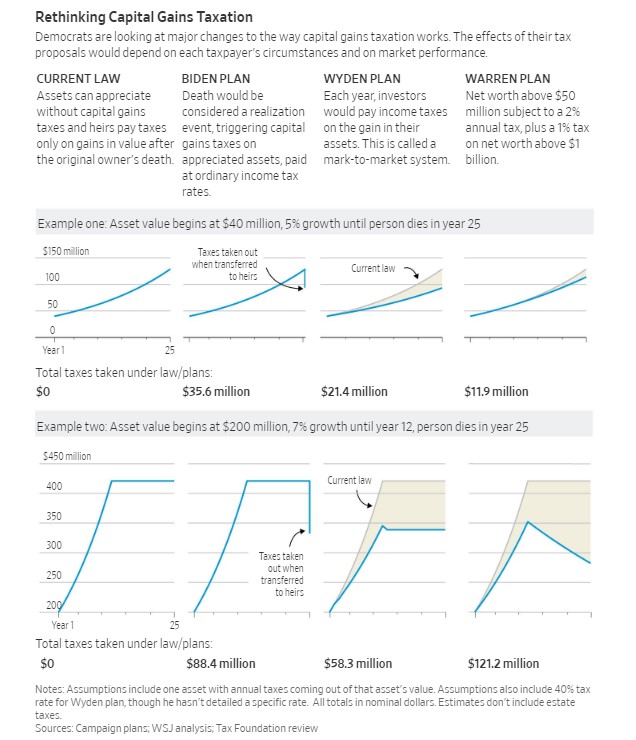
Wyden is the top Democrat on the Senate Finance Committee. Warren’s plan is the most aggressive which is in tune with her brand of politics being to the left. The average of the latest polls has Biden at 28.9%, Sanders at 17.1%, and Warren at 16.5%.
Conclusion
The consumer drove growth in Q2. Residential investment should join consumption as having a positive impact on GDP growth soon. The July pending home sales report was likely a one-off. If it’s not revised higher and the August reading is weak, we will change our tune. International earnings will be a sore spot for US firms as the global economy is weak. The global economy could turn around with help from a trade deal. This is no indication one is on the docket just yet. The Democrats want to raise capital gains taxes to deal with income inequality.
Have comments? Join the conversation on Twitter.
Disclaimer: The content on this site is for general informational and entertainment purposes only and should not be construed as financial advice. You agree that any decision you make will be based upon an independent investigation by a certified professional. Please read full disclaimer and privacy policy before reading any of our content.


