UPFINA's Mission: The pursuit of truth in finance and economics to form an unbiased view of current events in order to understand human action, its causes and effects. Read about us and our mission here.
Reading Time: 5 minutes
July monthly headline durable goods orders growth was very strong. Growth of 2.1% smashed estimates of 1.2%. Yearly growth increased from -1.9% to 1%. However, growth was driven by the volatile aircraft orders. Civilian aircraft orders increased 48% monthly after increasing 101%. Orders had fallen 39% and 52% in April and May because of the grounding of the Boeing 737 MAX plane. Yearly growth has improved from -77% in May to 13% in July. The MAX 737 is still grounded, but aircraft orders have recovered. New orders for defense aircrafts and parts were also elevated as monthly growth was 34% following -38% growth.
Because aircraft orders are so volatile, they are excluded from calculations of cyclical changes to the economy. For that we look at core capital goods orders and ex-transportation orders. Before we get there, it’s notable that motor vehicle orders were up 0.5% (following 2.7% growth) which is different from the July motor vehicle sales report which showed a sequential decline. Economists are very focused on the auto industry because auto loans have an elevated delinquency rate and the sector was blamed for the manufacturing weakness in the August flash Markit report.
Don’t Be Confused By Monthly Headline Growth
The true test of the durable goods report came up way short as monthly ex-transportation orders growth missed estimates for no growth, coming it at -0.4%. Technically, core orders growth beat estimates as it came it at 0.4% instead of 0%. However, the comp was revised much lower as June’s growth was revised from 1.9% to 0.9%. On a monthly basis, that’s a huge revision. The chart below shows yearly growth fell from 0.9% to -0.5%. That’s the first yearly decline since November 2016.
The 2 year growth stack fell from 9.3% to 8.6% even though the comp got tougher in June.
Shipments of core capital goods, which goes directly into the calculation of non-residential fixed investment growth in the GDP report, fell 0.7%. Another bad sign is inventories were up 0.4% while total shipments fell 1.1%. Eventually, that means orders will decline if that situation keeps up. That’s different from the Q2 GDP report in which inventory investment hurt GDP growth, while consumption growth was strong.
Another Negative Chicago Fed National Activity Index
There doesn’t seem to be a very good understanding of the difference between weak and recessionary data in the financial media and on FinTwit. The Chicago Fed national activity index is a great example of this because it was negative for the 7th time in 8 months, but there is still not even close to a recession signal being given. The 3 month moving average needs to fall below -0.7 for there to be a recession. In July the 3 month average rose from -0.3 to -0.14 because the terrible April reading of -0.83, which was the worst reading since early 2014, was lapped out of the average.
The July reading of -0.36 is the worst of the current average as the chart below shows.
The production indicators hurt the index by -0.25. Personal consumption and housing hurt it by -0.06. Sales orders and inventories hurt it by 5 basis points and employment hurt it by 1 basis point. Growth is below average across the board in the main categories, but the economy is far from a recession. Specifically, 26 individual indicators helped the index and 59 hurt it.
Very Strong Dallas Fed Manufacturing Index
Heading into the August Dallas Fed manufacturing report, 2 of the 3 regional Fed indexes had fallen from July. Because the Dallas Fed index improved by much more than those reports fell, it pulled the entire average higher. By just looking at the average of 4 of the 5 reports, the manufacturing ISM PMI should improve slightly. The chart below shows a model of the regional Fed indexes has the PMI coming in at 54.1 which would be a solid improvement from July’s reading of 51.2.
You don’t usually see economists take deep dives into regional Fed manufacturing reports because these reports are only a small potential picture of the ISM PMI which itself is an estimate of industrial production. However, it’s interesting to see that this report, which had its production index increase from 9.3 to 17.9 and its general activity index increase from -6.3 to 2.7, had every category in the expectations index decline except for delivery time.
Let’s review an interesting quote from the report. It’s no surprise these quotes mentioned the trade war often. A transportation equipment manufacturing firm stated, “Although we are required to “Buy American” for material procurement, uncertainty in the import marketplace relating to tariffs continues to put upward price pressure on U.S.-sourced supplies. We are eager to see a clearer rationale behind this administration’s attempts to develop a business strategy.” These firms obviously don’t like the trade war.
China Supposedly Back to The Table Ahead Of Big Action
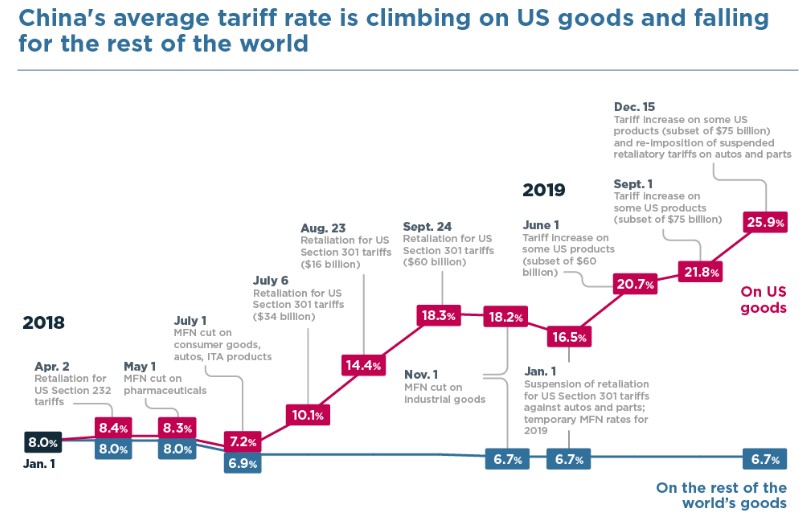
Trump stated China came back to the negotiating table after he announced the latest tariffs (China doesn’t support this claim). He tends to speak positively on trade after big declines in the stock market related to trade such as the selloff on Friday. The stakes of the negotiations are much higher now. The chart below shows all the tariffs about to go into effect in the next few months.
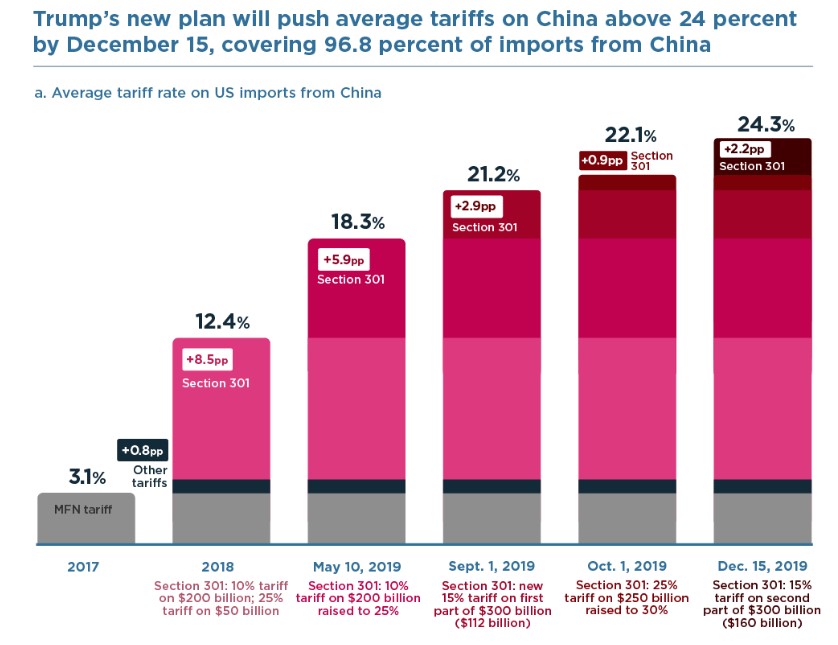
The 15% tax on $300 billion in imports (a lot of consumer goods) goes into effect in 2 parts on September 1st and December 15th. The tax rate on $250 billion goods increases from 25% to 30% on October 1st. By December 15th, 98.6% of imports from China will be taxed at a 24.3% rate.
Just like how Trump is trying to make deals with the rest of the world (a trade deal with Japan was just announced) to alienate China, China has lowered tariffs on the rest of the world and raised them on America. Since the start of 2018, the tax rate on the rest of the word’s goods fell from 8% to 6.7%. The rate on US goods increased from 8% to 20.7%. It’s set to increase to 25.9% on December 15th.
Conclusion
The durable goods orders report showed weakness outside of aircrafts. This isn’t as bad as the 2015-2016 manufacturing recession though as yearly capital goods orders growth troughed at -8.9%. The Chicago Fed national activity index’s 3 month moving average improved because April was lapped out. It is now giving less of a recessionary signal than last month even though 7 of the past 8 readings have been negative. The Dallas Fed manufacturing report’s general activity index improved, but so did uncertainty because of the trade war. The tariffs on Chinese and American goods are set to increase further in the next few months which could further slow the economy.
Have comments? Join the conversation on Twitter.
Disclaimer: The content on this site is for general informational and entertainment purposes only and should not be construed as financial advice. You agree that any decision you make will be based upon an independent investigation by a certified professional. Please read full disclaimer and privacy policy before reading any of our content.


