UPFINA's Mission: The pursuit of truth in finance and economics to form an unbiased view of current events in order to understand human action, its causes and effects. Read about us and our mission here.
Reading Time: 4 minutes
In this cycle, states have made it more difficult to qualify for unemployment benefits and have lowered benefits. You can say that in itself is a signal of a strong economy because there would be national outrage if the unemployment rate was high. Remember, early in this expansion the length of unemployment benefits was extended to 99 weeks because people had such a tough time getting a job. The social safety net needed to be strong.
This change means jobless claims are probably signaling the labor market is stronger than it is. The ratio of jobless claims to the population is at a record low. We aren’t saying the labor market is weak. It just might not be the strongest ever. Jobless claims data is one of the best recession forecasting indicators. It’s worth double checking it’s accuracy though because new laws mean historic comparisons aren’t ‘apples to apples.’ Unsurprisingly, the chart below shows Google searches for “unemployment benefits” are very low.
This supports the strong indication the current low claims give. The 4 week moving average of initial claims is just 214,500.
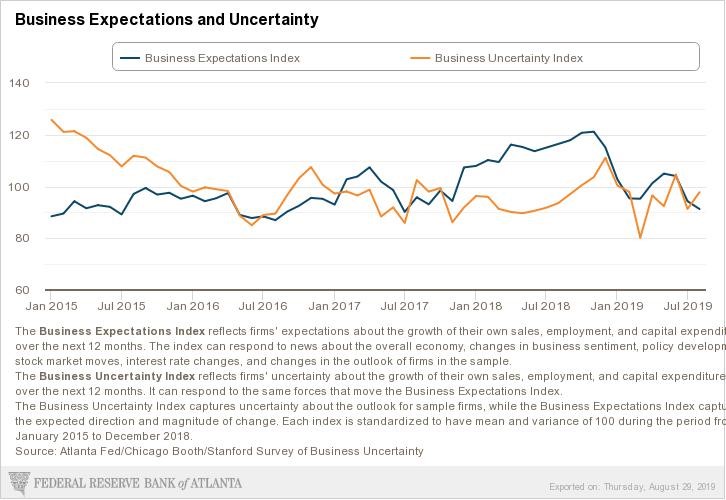
Uncertainty Is Elevated
In a previous article, we mentioned how business confidence is being hurt by the trade war while consumer confidence is still very strong. The chart below shows the Atlanta Fed’s survey of business uncertainty. It’s elevated, but not as much as you’d expect.
The index rose from 91.3 to 97.8 in August which is the highest reading since June. However, there were a few readings higher than this in each of the past 4 years.
On the other hand, business expectations showed a relatively high level of pessimism as the index fell from 94.3 to 91.3. That’s the lowest reading since July 2017. In the 2015 to 2016 slowdown, the index bottomed at 87. Within expectations, sales growth fell from 96.3 to just 87.7 which is the lowest reading since August 2017. Capex was surprisingly strong; you’d think the trade war was preventing investment. It increased from 106.3 to 112 which was the best reading since July 2018. Finally, the employment index increased from 99.6 to 102.6 which is in the middle of where it has been in the past few years.
Potential Trade Escalation Measures
The tariff lever has been pulled in the trade war, meaning by December 15th, most of what can be taxed will be taxed. Some see this as reason to believe a trade deal is coming because both sides will want to prevent such negative measures from being implemented. Obviously, as investors we can’t be complacent and need to explore the possibilities.
The table below shows what China can do in 2020 if the trade war escalates further.
China can slow exports of key goods to America. It can act against American companies doing business in China. Trump can’t stop firms from doing business in China, but China can if the trade war gets that far. China can also sell American assets and make aggressive stances against the US on key geopolitical issues such as North Korea’s nuclear weapons.
Housing Price Growth Weakens Again
The Case Shiller national price index’s yearly growth rate fell from 3.4% to just 3.1%. That’s the weakest growth since September 2012. It’s not a huge surprise housing price growth continued to fall in the Case Shiller and FHFA indexes because the latest data is from June. In June, the average 30 year fixed mortgage rate was 3.8% which is low, but now it’s at just 3.58%. The June comp was 6.2% which is tough. The yearly growth comps will get easier in the next few months. That along with the decline in rates should prevent growth from falling much further in the next few months. By September the yearly growth comp will fall to 5.5%.
Home affordability is up because interest rates have fallen significantly. That’s even though weekly wage growth is still below home price growth since wage growth has fallen in recent months. Average weekly wage growth in June was below home price growth as it was 2.8%. Average weekly wage growth will likely be below home price growth again in July since it fell to 2.6%. The decline in rates has been a bailout for the housing market. The fact that housing never reached the bubble territory of last cycle allows rates to cushion the weakness. Rates fell in the last recession, but that wasn’t close to enough to stem the bleeding.
FHFA data has had higher growth for a while, but it’s heading lower as well. National yearly growth fell from 5.1% to 4.8% which was the weakest growth rate in 5 years.
Performance Of Big Cities
Big cities did worse than the national index as the 20 city index’s yearly growth rate fell from 2.4% to 2.2% which missed estimates for 2.3%. The table below shows the recent growth rates of the cities in this index.
Phoenix overtook Las Vegas as the top city. Las Vegas’s growth rate fell from 6.4% to 5.5% which is the lowest growth rate since August 2016. This is another hot city losing momentum. Phoenix’s growth rate only increased 1 tenth to 5.8%. That’s all it needed to be the best as the overall market is seeing lower growth. Seattle is the old hot market as its growth rate has plummeted from 13.6% in May 2018 to -1.3%. It had a terrible 2 year stack change since the comparison got easier. The 2 year growth stack fell from 12.4% to 11.5%
The chart below highlights the total cycle growth rates by city.
Seattle and San Francisco have some of the strongest total growth rates, but are now the two weakest cities. Charlotte has underperformed this cycle, but now is the 5th hottest housing market. The composite 20 has higher growth this cycle than the national market, but now its yearly growth is 0.9% lower.
Conclusion
The labor market is strong based on the low jobless claims and the Google searches for “unemployment insurance.” Uncertainty isn’t as elevated as you’d expect given the planned escalation of the trade war this fall. The trade war could move from economics to geopolitics in 2020 if it escalates further. Home price growth fell further in June. If price growth continues to fall, it will help housing affordability because rates are down. If rates were stable, affordability wouldn’t be improving because weekly wage growth is below price growth. The more price growth falls, the greater chance the housing market rebounds in 2020, all else being equal. Some of the previously hot cities are some of the weakest now. Las Vegas is even seeing its price growth fall significantly as it has been overtaken by Phoenix as the top market.
Have comments? Join the conversation on Twitter.
Disclaimer: The content on this site is for general informational and entertainment purposes only and should not be construed as financial advice. You agree that any decision you make will be based upon an independent investigation by a certified professional. Please read full disclaimer and privacy policy before reading any of our content.


