UPFINA's Mission: The pursuit of truth in finance and economics to form an unbiased view of current events in order to understand human action, its causes and effects. Read about us and our mission here.
Reading Time: 5 minutes
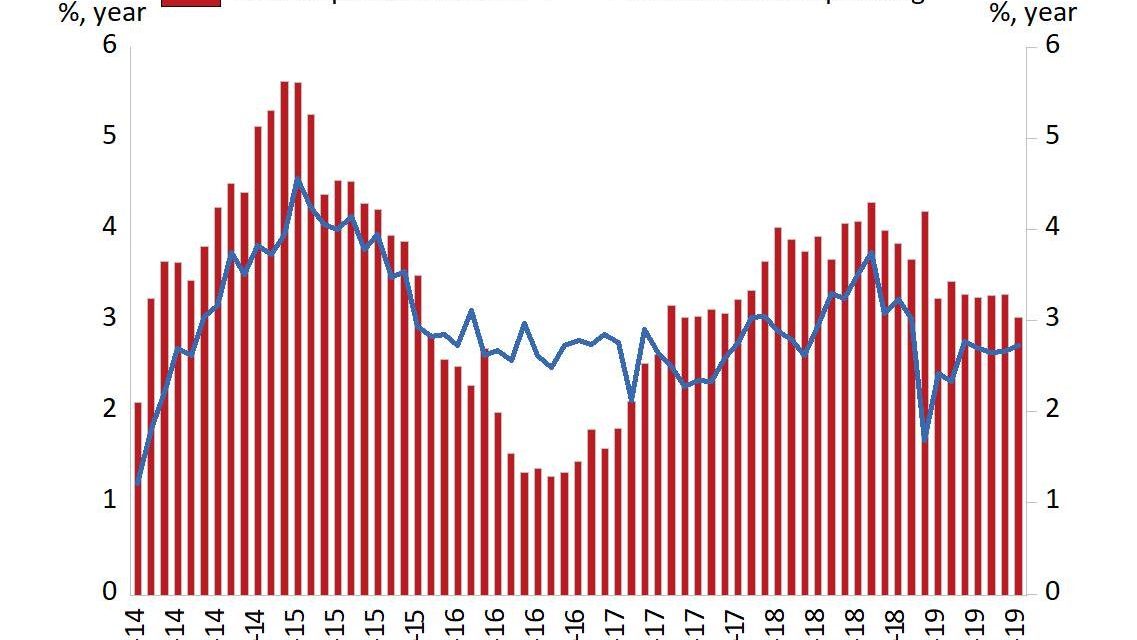
Monthly real disposable income growth missed estimates and real personal income growth was negative. However, the data in the July PCE report wasn’t terrible if you look at the whole report instead of cherry picking weak data points. Monthly income growth was below monthly consumption growth, but the reverse was true for yearly growth.
Let’s get into the specifics. Monthly real disposable income growth was 0.1% which missed estimates for 0.3%. However, the June reading was revised from 0.4% to 0.5%. Plus, yearly growth was 3%. Yes, that’s down from 3.3% and the weakest reading since April 2017, but it’s not bad compared to the 2016 slowdown as you can see from the chart below.
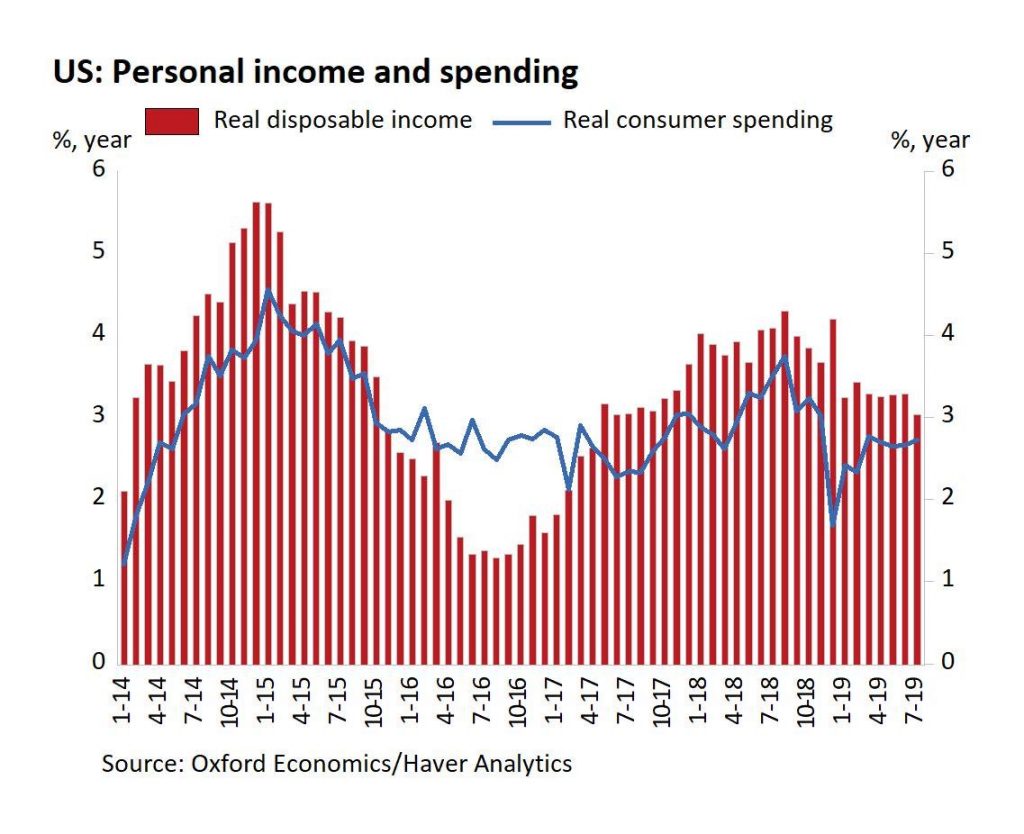
While real personal income growth looks worse on a monthly basis (-0.1%), it looks better on a yearly basis (3.2%). Income growth is everything because it drives consumption growth in a healthy manner. If consumption growth is quicker than income growth, debt increases.
Monthly nominal consumer spending growth was 0.6% which doubled June’s growth rate and beat estimates for 0.5%. Real monthly PCE growth was 0.4%. Yearly growth was 2.7% which is the best reading since March. We don’t agree with those saying the consumer is ignoring the trade war because the latest tariffs on consumer goods were announced and raised in August. This report is from July. As we will review later in this article, consumer sentiment took a turn lower in August. Interestingly, even though yearly consumption growth was below income growth, the savings rate fell from 8% to 7.7% which is the lowest reading since November 2018. Consumers might elect to take on more leverage at record low interest rates since household debt service payments as a percent of disposable personal income is low.
Inflation Misses Estimates
Both headline and core PCE inflation missed estimates. Remember, the Fed’s favorite inflation metric is core PCE. Headline PCE inflation was 1.4% which missed estimates for 1.5%. Also, June’s reading was revised down from 1.4% to 1.3%. Core PCE was 1.6% which was flat from June and missed estimates for 1.7%. The chart below shows core inflation has been contained for over 20 years.
Even though everything seems great, there might be a modest issue in the next few months. In this report, core inflation dealt with the toughest comparisons of this mini-cycle. In July 2018, core PCE was 2.11% which was the highest rate since January 2012. Comps will get easier in the next few months, potentially pushing core PCE closer to 2%. There is a possibility the Fed gets caught with rates too low if the Fed cuts rates two more times and that coincides with a trade deal and/or economic growth accelerates. This scenario with an improved growth probably sounds great since the economy is currently in a slowdown, but this situation is likely on the Fed’s mind. This could cause it to be slow to react to economic weakness. Because trade war situation can change quickly, the Fed may once again be cautious with rate cuts. However, one point that this might overlook is rate differentials between the Fed Funds rate and rates in the rest of the world.
University Of Michigan Consumer Confidence Craters
In a previous article, we mentioned how the Conference Board consumer confidence index is doing well, but the University of Michigan index is doing poorly. The latter portion was an understatement as the final reading of the August University of Michigan survey was worse than the preliminary reading. The preliminary reading was 92.1 and the final reading was 89.8 which missed estimates for 92.3. The July reading was 98.4 which means the drop was 8.6 points. That’s the worst monthly decline since December 2012 when consumers feared the fiscal cliff. This time the weakness is being catalyzed by tariffs.
Unsurprisingly, the weakness is mostly in the expectations part of the overall index. The current index fell from 110.7 to 105.3 and the expectations index fell from 90.5 to 79.9. The divergence between the current and expectations indexes increased. This divergence is the largest when expansions are old.
This survey is not just different from the Conference Board index. As you can see from the chart below, it also widely differs from the Bloomberg Consumer Comfort index.
The only thing that matters is if this leads to weakness in consumption growth in September. So far, there is no sign of weakness in the Redbook weekly same store sales report. The back to school shopping season seems to have gone well.
Earlier in Trump’s presidency, 35% of consumers made positive comments on the news they heard about government economic policy. That percentage has cratered closer to the long term average (low single digits) as it is 7%. The chart below shows the bifurcation in economic projections based on if the consumer mentioned tariffs negatively.
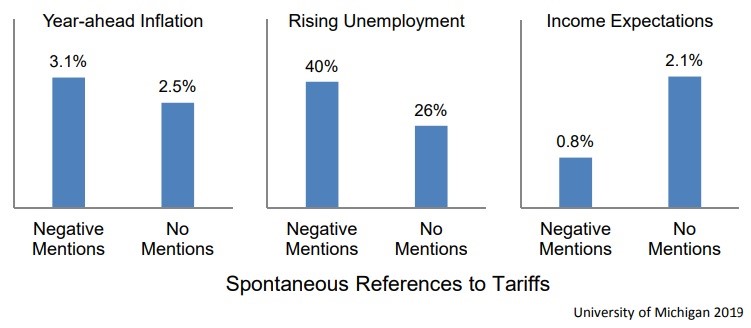
Those who spontaneously mentioned the tariffs think inflation will be higher, are more likely to say unemployment will rise, and see lower income growth. The scary part is more people will hear about the tariffs in the coming weeks as they start impacting consumer goods.
Much Improved Chicago PMI
The Chicago Fed business barometer index increased sharply in August as the chart below shows. It went from 44.4 to 50.4 which beat estimates for 47.5.
It beat the high end of the estimate range which was 49. July’s reading was a 4.5 year low. The 2 month contraction is over. The new orders index was up almost 10 points to 53.4. The order backlog index was up from 43.5 to 51.3 which ended the 3 month streak where it was below 50. The supplier deliveries index fell from 55.6 to 50.3. Production was up 6.7 points.
The employment index rose slightly to 43.7 which is just above its 10 year low. Inventories fell 11.2 to 47.9. Prices paid increased 3.7 to 59.8 which is a 5 month high. Finally, 27% of firms plan to increase investments, 10% plan to decrease them, and 63% will leave current plans the same. Keep in mind, this report measures the whole economy, so it’s a good sign for the non-manufacturing and manufacturing PMIs.
Conclusion
The July PCE report signals the consumer is in fine shape. However, the trade war might change that if the University of Michigan sentiment index is accurate. The Chicago Fed PMI signals the ISM PMIs will be solid in August as it showed a big sequential increase. It’s still only slightly above 50 which indicates slow growth.
Have comments? Join the conversation on Twitter.
Disclaimer: The content on this site is for general informational and entertainment purposes only and should not be construed as financial advice. You agree that any decision you make will be based upon an independent investigation by a certified professional. Please read full disclaimer and privacy policy before reading any of our content.


