UPFINA's Mission: The pursuit of truth in finance and economics to form an unbiased view of current events in order to understand human action, its causes and effects. Read about us and our mission here.
Reading Time: 5 minutes
When Fed chair Powell is asked about low inflation, he pivots to the products/services that have pulled inflation down. However, you don’t often hear discussion about how much lower inflation could be if there weren’t tariffs. Just because inflation is low, doesn’t mean there aren’t reasons it can’t fall. President Trump recently ended the 25% and 10% tariffs on steel and aluminum for Canada and Mexico, but the new tariffs on China which were announced on May 10th are much larger. If there is a trade deal with China, this pricing pressure will abate.
The best case scenario for the Fed to avoid having to cut rates in 2019, is for there to be a trade deal which would lead to an upswing in the economy, subsequently, boosting inflation. However, there is also cyclical weakness which might prevent a boom.
Inflation Is Modest Without Tariffs
As you can see from the chart below, the price of Chinese imports affected by tariffs increased over 20%, while imports unaffected by tariffs have seen their prices fall.
The CPI across 9 tariff impacted categories is up almost 4% since the start of 2018. Prices for all other goods have fallen this year. In these charts, prices are indexed to February 2016.
No Inversion Yet
The Fed and the Fed funds futures market have a big disagreement on future policy. Expected Fed rate cuts explain why the 2 year yield is at 2.24% which is below the effective Fed funds rate of 2.42%. If the Fed was expected to raise rates, the 2 year yield would be above the 10 year yield of 2.42%. That inversion would push the linear model over a range of treasury maturities, seen in the chart below, towards an inversion. However, there isn’t an inversion yet.
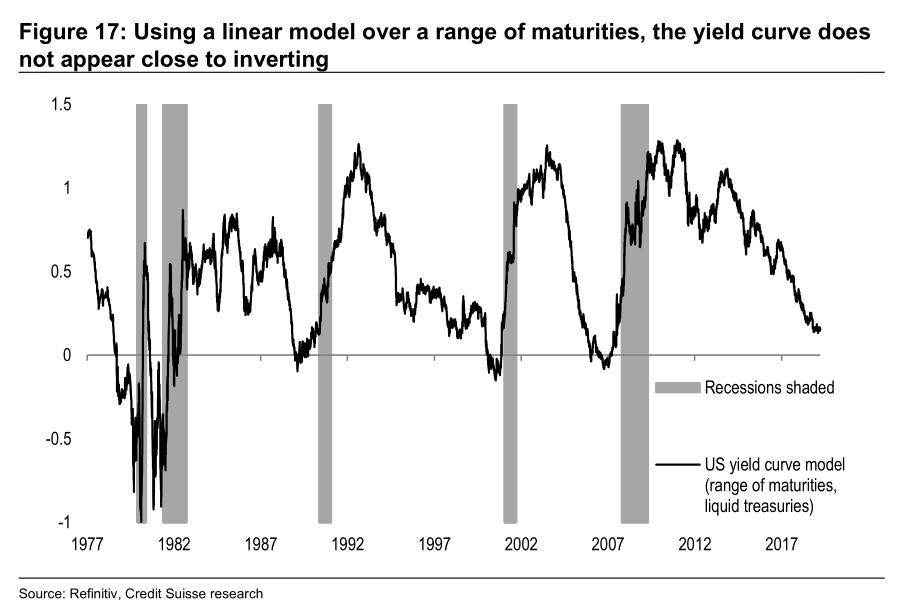
It’s important to use this indicator rather than just looking at one part of the curve. The excess fear created when the 5 year yield first went above the 7 year yield last year wasn’t warranted.
There is a chance the Fed flattens the curve if it follows through on its guidance of no hikes or cuts this year because the Fed funds futures market is pricing in a 67.2% chance of at least one cut this year. By September, there is a 37.1% chance of at least one cut with no chance of a hike. That’s while Atlanta Fed President, Raphael Bostic, stated, “I would say I’m not expecting a rate cut to be imminent, certainly not by September. Things would need to happen in order for that to play out.” If the Fed guides for no hikes or cuts at its June 19th meeting, look to see if the yield curve flattens. There appears to be cyclical economic weakness the Fed isn’t catching.
Weak Chicago Fed National Activity Index
The March Chicago Fed index was revised sharply higher from -0.15 to 0.05. When a reading is positive, it means above trend growth. However, April’s reading was -0.45. Anything -0.7 or below is historically equivalent to a recession. As you can see from the chart below, the monthly readings are volatile. That makes the 3 month average valuable. It fell from -0.16 to -0.22 which isn’t that far from the trough of the last slowdown.
Watch this stat closely in the next few months to see if this slowdown is worse. It’s notable that the 3 month average actually improved from the originally reported -0.24 because the March reading was revised higher by so much.
Production indicators were the main cause of the weakness in April. They hurt the index by 0.44 which was worse than the -4 basis point impact in March. This weakness was caused by the industrial production report. One must wonder how much stronger the calculation would have been without the calendar quirk hurting results. However, it’s not like results would have been amazing without production as the personal consumption and housing component hurt the index by 5 basis points. It was neutral in March. It will be interesting to see if the latest housing report beats help this index. The consumer product tariffs could also hurt this component in the next few months. Finally, employment and sales/orders/inventories were almost unchanged which is worse than the slight positive reading in March.
Existing Home Sales Miss Estimates
The existing home sales report doesn’t matter to GDP, but it is important because most homes sold are in this category. As you can see from the chart below, sales of 5.19 million in April fell slightly from 5.21 million which missed the low end of the expected range which was 5.25 million.
Sales fell 0.4% monthly and 4.4% yearly which was an improvement from the declines of 4.9% and 5.4% in March.
The good news is the 3 month average of 5.293 million was the highest since September. The 3 month average of existing single family home sales which was 4.733 million was the best reading since August. There was a big burst in supply as it was up 9.6%. This pushed supply to 4.2 months from 3.8 months as many people are selling existing homes to buy new homes. Existing home prices were up 2.9% monthly and 3.6% yearly to $267,300. Sales in the West improved 1.8% monthly to 1.11 million, while sales in the South fell 0.4% to 2.27 million.
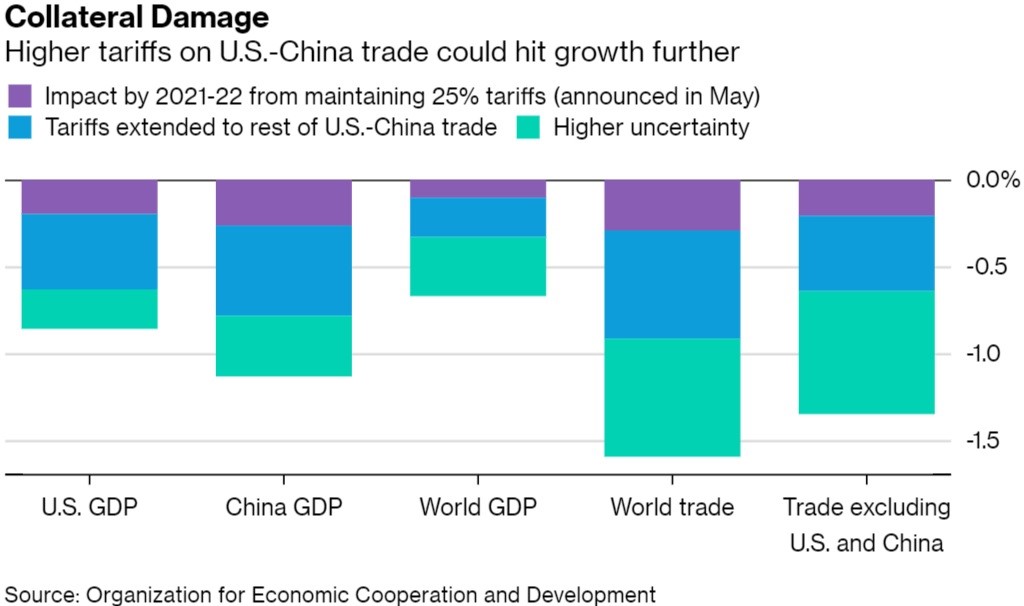
China Not Likely To Sell Treasuries, But There Is Huge Uncertainty Risk
The trade war with China will create uncertainty which will hurt economic growth. However, China is not likely to sell U.S. treasuries despite what some media outlets claim. If China sells treasuries and then dollars, it would put downward pressure on the dollar index which would help America. It could also cause treasury yields to fall in a flight to safety trade as growth would slow and uncertainty would rise. As you can see from the chart below, uncertainty is a large component of the potential effect of the trade war on GDP.

Maintaining the 25% tariffs announced in May until 2021-2022 could hurt world GDP by 0.6%. Half of that negative impact is from uncertainty.
Conclusion
Growth and inflation are low partially because of the trade war, but also because of cyclical weakness. If the trade war continues, it will hurt growth which would likely result in rate cuts. The Fed funds futures market and the Fed strongly disagree on policy for the rest of the year. Existing home sales were weak on a monthly basis, but strong on a 3 month basis. Yearly growth will be positive near the end of the year because of the very weak comps.
Have comments? Join the conversation on Twitter.
Disclaimer: The content on this site is for general informational and entertainment purposes only and should not be construed as financial advice. You agree that any decision you make will be based upon an independent investigation by a certified professional. Please read full disclaimer and privacy policy before reading any of our content.


