UPFINA's Mission: The pursuit of truth in finance and economics to form an unbiased view of current events in order to understand human action, its causes and effects. Read about us and our mission here.
Reading Time: 4 minutes
The 3 month average of yearly nominal wage growth for those making less than $15 per hour is almost 5%, demonstrated in the chart below. In each subsequent higher hourly earnings group growth is lower, with those making more than $45 per hour only seeing slightly more than a 1% raise which doesn’t even keep up with inflation.
Low End Of Labor Market Seeing Fastest Wage Growth
It continues to shock many people that those on the low end of the wage spectrum are seeing the highest pay growth. That’s probably because of two reasons. First, if you are barely making ends meet by making $13 per hour, you won’t exactly be living in riches by making 5% more. Modest improvements aren’t talked about as much as hardships such as those caused by mass layoffs. Secondly, even though people at the low end of the spectrum are seeing high pay growth, that doesn’t mean wealth inequality has improved. Those making $45 or more per hour likely saw big gains this year in their stock market portfolio. Those with credit card debt or student loan debt are paying higher interest rates than their income growth.
Low End Helped By Minimum Wage Hikes & Tight Labor Market
Those on the low end of the spectrum are being helped by state minimum wage hikes and the fact that the labor market has been tight for those without a high school diploma. In 2019, 19 states increased their minimum wage. These increases don’t just affect those making the minimum wage. They also lead to increased pay for those making slightly more than the minimum wage.
The employment to population ratio for those 25 years old and over without a high school degree peaked at 44.9% in October 2018. That’s the record high going back to 1992. As of April, it’s at 42.8% which is only slightly below last cycle’s peak of 44.5%. This metric is highly volatile which is why the trend is your friend. This is historically high compared to the same age group with a high school degree. Those with a high school degree have an employment to population ratio of 55.9% which is significantly below last cycle’s peak of 61.5%.
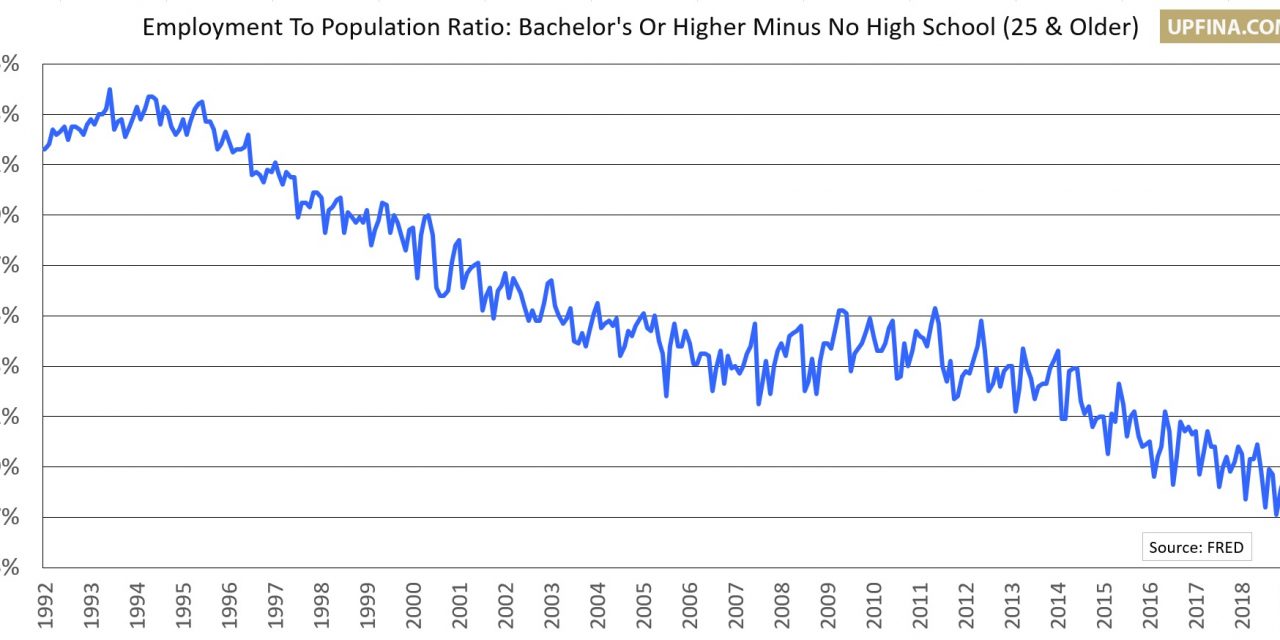
The employment to population ratio for those with a Bachelor’s degree or higher is 72.3% which is below its previous cycle peak of 77.2%. This drop relative to those without a high school diploma is shown in the chart below.
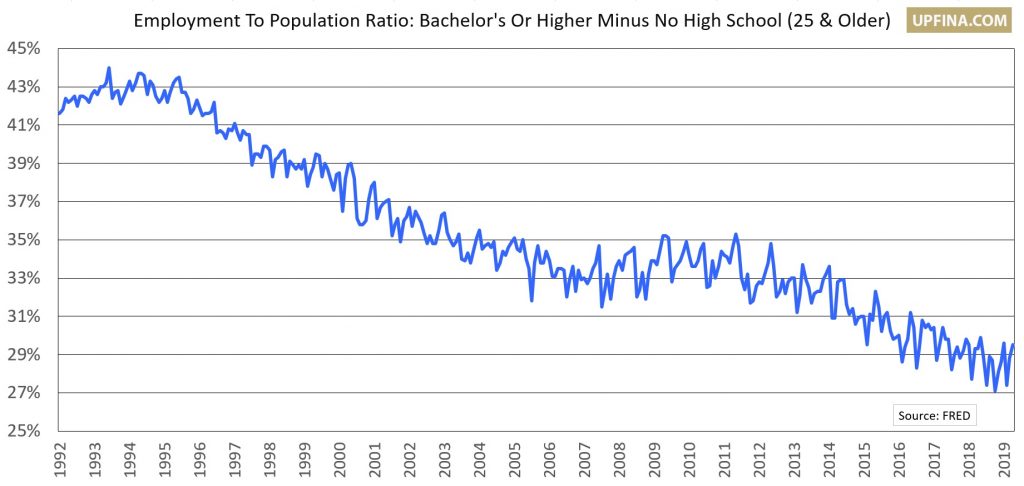
Those with a college degree or higher still get paid more and have a 30% higher employment to population ratio. We’re just showing how tight the low end of the labor market is.
America Not As Vulnerable To Automation
Most of the stories about automation explain how it’s going to be a disaster for workers. The relatively high employment to population ratio for those with little education and the overall low unemployment rate have hampered the doom and gloom surrounding automation. Claims that millions will lose their jobs lose their effectiveness when so many people have a job.
As you can see from the chart below, American workers have a relatively low risk of automation.
According to Deutsche Bank, about 10% of American workers are at high risk of automation which is defined as a job with 70% or more risk of automation. The expected value here is about 7%, although you’d also need to add in the large majority of jobs that have a medium/low risk of automation.
Trade Between America & China Crashes
The trade war with China is headed in the wrong direction as measured by the SOXX Semiconductor ETF. It is down 15.1% since April 24th. As you can see from the chart below, trade between America and China has cratered since mid-2018 when the trade war was just getting started.
In Q1 2019, American exports to China were down 31% yearly; Chinese exports to America were down 9% yearly. The decline of $25 billion equates to 0.5% of global trade. You can use this to measure how strong global trade would have been without the trade war. As of early April, the WTO expects merchandise global trade volume growth to fall from 3% to 2.6% in 2019. The weakness in trade growth is caused by both cyclical and political factors.
Trade War’s Effect On Earnings
The graphic below looks at the share of cost of goods sold which comes from Chinese imports to calculate the effect on S&P 500 EPS in various situations. This graphic is probably too optimistic because the 25% tariff on $200 billion worth of Chinese goods has already been implemented.
If you include the 21 days it takes ships to get from China to America, the tariff will affect goods on May 31st which is in just 10 days. That should be the base case. In this situation, 2019 EPS will be hurt by 2% and the pricing needed to offset this decline is less than 1%.
The severe case is 25% tariffs on all Chinese goods. That would hurt 2019 S&P 500 EPS by 6%; pricing needed to offset this weakness is 1%. To be clear, it’s tough to measure the effect these tariffs will have because we don’t know when they will be implemented. Usually, after a tranche of tariffs is implemented there is a negotiation period. It wouldn’t make sense to just keep escalating without at least trying to negotiate to see if the latest tactic moved the negotiating dialogue. Therefore, the impact of the next tariff tranche on 2019 earnings could be small.
Conclusion
To our readers, it’s no secret that low wage workers are getting big raises. As investors, we should care about all trends to find the best ways to make money. Regular people making less than $15 per hour probably don’t feel much of an impact. However, it’s definitely more noticeable for those who make the minimum wage since it’s highly publicized and it would be illegal if employers didn’t pay this wage. The tariffs will unfortunately wipe away the gains for low income workers because the tranche that is starting includes a lot of consumer goods. The next tranche will be even worse. The direct impact on S&P 500 firms’ EPS could be between 2% and 6% this year. The trade war’s impact could be greater than this because many businesses are holding off on big investments until they get clarity on the trade situation.
Have comments? Join the conversation on Twitter.
Disclaimer: The content on this site is for general informational and entertainment purposes only and should not be construed as financial advice. You agree that any decision you make will be based upon an independent investigation by a certified professional. Please read full disclaimer and privacy policy before reading any of our content.


