UPFINA's Mission: The pursuit of truth in finance and economics to form an unbiased view of current events in order to understand human action, its causes and effects. Read about us and our mission here.
Reading Time: 4 minutes
The map below shows jobless claims as a percentage of the workforce. You can use this if a stock you’re investing in has a big presence in a specific region. For example, you’d rather have a presence in the Southwest; states like Texas and Arizona only have 6.4% and 5.9% of the labor force on unemployment insurance. The Northeast and Midwest are in worse shape as New York and Michigan have 15.9% and 19.5% of the labor market filing for claims.
Michigan is being hurt by the decline in the auto industry. Nevada is being severely impacted by the decline in travel (worst Southwest state by far). Texas and North Dakota aren’t being impacted much by the decline in the energy industry probably because it doesn’t employ that many people.
Georgia has the 2nd worst labor market. That might be motivating the governor to reopen the state later this month. Gyms, salons, and bowling alleys are set to open on Friday and movie theaters and restaurants will be allowed to open on Monday. The major movie chains, which are AMC and Cinemark, don’t plan to open until June and July which makes one wonder which theaters will actually be open. Of even more importance is who will actually be going out. We think demand will be weak in this uncertain environment. However, just because Georgia’s early open might be a flop doesn’t mean when other states open in mid-May or later, there will also be a lack of demand. When states show people the situation is under control, they will start returning to a new normal. As of Tuesday, Georgia had 20,166 cases which put it in 12th place in America. The data in Georgia in the next few weeks could impact stocks as we await to see if there is a spike in new cases.
According to the healthdata.org model, the peak in hospital resources was on April 21st. It seems like Georgia is reopening a couple weeks too early. New York will be closed until at least May 15th even though the hospital use peak was April 9th. Obviously, the situation isn’t the same as New York is very densely packed and had its hospitals overrun with people. Thankfully, the situation is improving in New York as the number of new COVID-19 hospitalizations has fallen for 4 straight days.
Labor Market In Deep Trouble
As the COVID-19 situation improves enough to partially reopen the economy with social distancing in May and June, the focus will shift to the impact on the economy. It’s like assessing the damage after a natural disaster. The damage is wide and deep. We will see it in the April hard data reports. So far, we only have the March labor report which was terrible. As you can see from the chart below, of the decline in employed people at work, about 1/3rd are employed but not at work, 1/3rd are not in the labor force anymore, and 1/3rd are unemployed. The longer the shutdown goes, the harder it will be for the economy to recover because ties between workers and employers will be severed and many businesses will be gone.
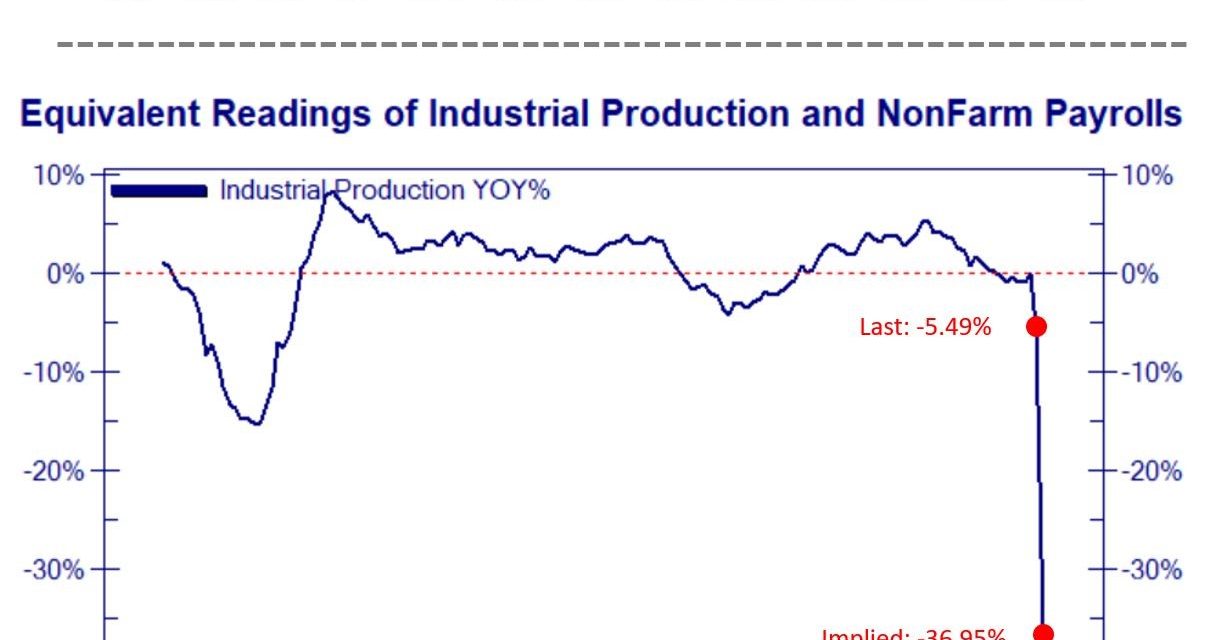
Record Low Decline In Industrial Production Coming
The 3 charts below show the NY Fed’s weekly economic index and the projections it implies. Yearly growth in the index is below -10% which is more than 2 times worse than the bottom of the last recession. It is increasingly likely than this recession will be deeper than the financial crisis. The unemployment rate is already near 16% if you use jobless claims to model the rate. It might top out near 20%. It only peaked at 10% in 2009.
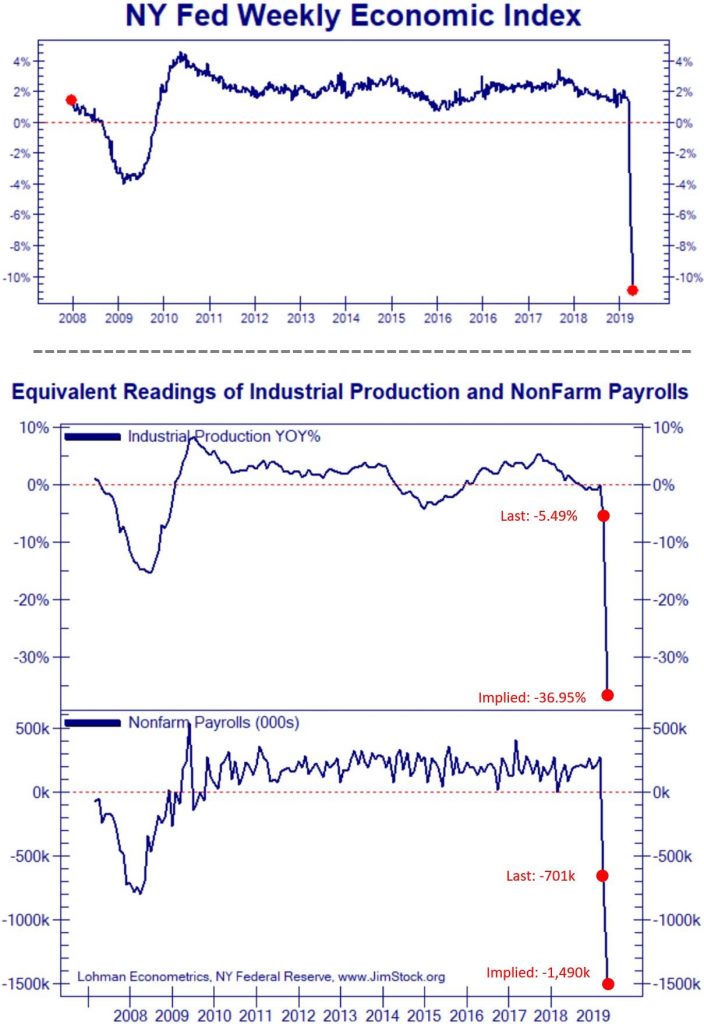
The macroeconomic equivalents are very intriguing. They give us an educated guess at what the data will show. As you can see from the middle chart above, yearly growth in industrial production is expected to plummet from -5.49% to -36.95%. This growth rate bottomed at -15.3% in the last recession. That means this recession will be at least twice as bad. The worst growth rate ever was in February 1946 which had a decline of 33.6%. Just by this implied metric, this recession is worse than the Great Depression (for the manufacturing sector). The good news is this might not even be a depression because of the fiscal and monetary policy stimulus coupled with the fact that the cause of the decline was an exogenous shock not an imbalance in the economy.
The third chart above shows there will be 1.49 million jobs lost in April. The trough in March 2009 was -800,000. This will almost be twice as bad as the trough of the last recession. The previous worst decline ever was in September 1945 when the economy lost 1.959 million jobs. It’s entirely possible next Friday’s BLS report is worse than the NY Fed’s implied guess.
Philly Fed Non-Manufacturing Index
The Philly Fed non-manufacturing index has only been around since 2011, but if it was around for over 100 years, it wouldn’t have a worse reading than the one in April. Only 1.8% of firms saw an increase in business activity in the Philly area and 98.2% saw a decrease. The new orders index fell from 16.4 to -67.2. Only 0.3% of firms saw an increase in new orders. You can’t have an increase in new orders if the entire economy is shut down. The sales index fell from -4.9 to -87.9. Literally, zero firms had an increase in sales. Similarly, there were zero firms that increased the number of part time, temporary, and contract employees.
Conclusion
Georgia was one of the worst hit states economically by the shutdown. Let’s see how its economy rebounds in May. It seems likely to be a slow grind higher because the COVID-19 situation isn’t fully under control. At least New York hospitals are in better shape than they were 10 days ago. The earlier the economy reopens, the quicker the labor market will recover. The NY Fed index projects the biggest decline in industrial production ever. The Philly Fed index showed almost no firms saw an increase in new orders and none hired more part time workers.
Have comments? Join the conversation on Twitter.
Disclaimer: The content on this site is for general informational and entertainment purposes only and should not be construed as financial advice. You agree that any decision you make will be based upon an independent investigation by a certified professional. Please read full disclaimer and privacy policy before reading any of our content.


