UPFINA's Mission: The pursuit of truth in finance and economics to form an unbiased view of current events in order to understand human action, its causes and effects. Read about us and our mission here.
Reading Time: 4 minutes
Based on continued claims in the survey week, consumer confidence, the ISM services employment index, the household pulse survey, and the ADP private sector payrolls survey, this July labor report was supposed to be very weak. We actually thought there might be job losses. This was completely wrong as there were 1.763 million jobs added. That’s below the 4.791 million added in May, but that’s a given. Even if we saw no economic slowdown, there was always going to be fewer jobs added because the easiest fruit had been picked.
There is still plenty of room left in the labor market obviously. It’s just that the trend is towards more normalized job creation. This report slightly beat estimates for a 1.675 million increase. This report is very exciting because we are left to imagine how great the reading would have been without the spike in COVID-19 cases in the hotspots. We already saw the labor market is starting to improve at a more rapid pace in the jobless claims reading from the week of August 1st. There might actually be more jobs created in August than July. You know this report was great because on Friday the small cap value index rose 2.4% even though a stimulus package wasn’t passed.
Where The Jobs Were
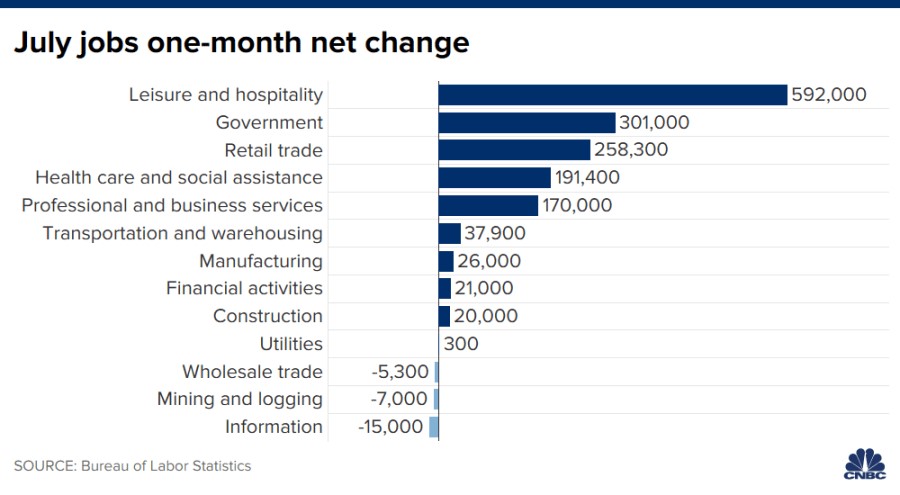
There were 301,000 government jobs added which means there were 1.462 million private sector jobs added which slightly missed estimates for 1.525 million. That’s immaterial when you consider private sector job creation was about 1.3 million above the ADP reading and we thought there might be job losses. As you can see from the table below, there were 592,000 leisure and hospitality jobs added. This industry pays the least, but it still needs to add the most jobs. At the bottom it lost almost half its jobs. It’s now down 25.7% since February.
On the other side, information lost 15,000 jobs and it pays its workers the most. Even though the tech sector has had a great recovery since the bottom in March, this sector has experienced the 3rd most losses on a percentage basis. Information employment is down 11.4% since February. Manufacturing created 26,000 jobs. This sector is experiencing a strong recovery, but don’t expect it to drive job creation as this is a service based economy.
Permanent Job Losses Maintained
The fear has always been that permanent job losses would slow a recovery. The temporary job losses are easy to regain, while the permanent losses would be a long slog to regain like a typical recession. There were 2.9 million permanent job losses in July which is slightly lower than in June.
The chart below shows the decline in the unemployment rate for temporary job losses and basically no change in the non-temporary losses. Some economists are saying this is as good as it gets because unemployment insurance ran out. We disagree. This solid report came in spite of a rise in COVID-19 cases in the south and the west. If the recent decline continues, the labor market will rapidly improve in August with or without a bolstered stimulus (compared to Trump’s executive order). To be clear, the stimulus is still important. Last month we mentioned that a weak jobs report might encourage Congress to make a deal quicker, but instead we got a great report. It’s also notable that there were strong job gains again even with the boosted unemployment benefits in July, proving again that people aren’t purposely staying unemployed to collect benefits.
The labor market is obviously still in terrible shape as the current unemployment rate is higher than the peak in the last cycle. In this report, it fell from 11.1% to 10.2% which was below the consensus of 10.5%. In the first 3 months of the last recovery, the unemployment rate only fell from 10% to 9.8%. In this recovery it has fallen 4.5%. If the jobless claims report from the week of August 1st is any indication of August’s report. The U3 rate could fall even more than it did in July. The U6 unemployment rate fell from 18% to 16.5%. Since it fell more than the headline rate, there were fewer under-unemployed people.
Participation Rate & Wage Growth
The labor force participation rate fell 0.1% to 61.4%. That’s still good since it rose 0.7% last month. Generally, when this metric rises fast, it reverts back. It was at 63.4% before the recession. It might never get back to the pre-recession rate because it’s in a long term downtrend as baby boomers age and retire. By the time the labor market gets as full as it was in February 2020, many boomers will have aged out of the labor force. The prime age labor force participation rate fell from 81.5% to 81.3%. It’s 1.7% below where it was in February.
Average hourly earnings growth was 4.8% on a yearly basis which was down 0.1% from June and above estimates for 4.1%. Growth was pretty strong when you consider that the most jobs were created in the lowest paying industry and the most losses were in the highest paying industry.
The Craziest Chart of The Year
The chart below is the craziest chart of the year. That’s saying something because we have extreme rallies in precious metals and speculative stocks along with a V shaped recovery in the housing market. As you can see, the used car index had a recessionary decline in 1 month and then a meteoric rise off the bottom in the next 3 months. Normal used car supply is 44 days of sales, but in July it was 34 days as there is a used car shortage. Cox Automotive estimates used vehicle sales fell 4% yearly which beat out the 12% decline in new vehicle sales. Wholesale used vehicle prices rose 5.8% monthly and 12.5% yearly. Cars are important when public transportation carries virus risk. Plus, people are doing more outdoor activities.
Conclusion
This was a very strong jobs report which is different from what we expected based on a number of indicators. If the labor market can grow solidly when COVID-19 cases are spiking, imagine how good it will do when cases are falling like they are in August. The used vehicle index had an unbelievable rebound as people are using public transportation less and need a car for various social distancing activities. People are also flying much less and have extra savings. This is the perfect storm for used car demand.
Have comments? Join the conversation on Twitter.
Disclaimer: The content on this site is for general informational and entertainment purposes only and should not be construed as financial advice. You agree that any decision you make will be based upon an independent investigation by a certified professional. Please read full disclaimer and privacy policy before reading any of our content.


