UPFINA's Mission: The pursuit of truth in finance and economics to form an unbiased view of current events in order to understand human action, its causes and effects. Read about us and our mission here.
Reading Time: 5 minutes
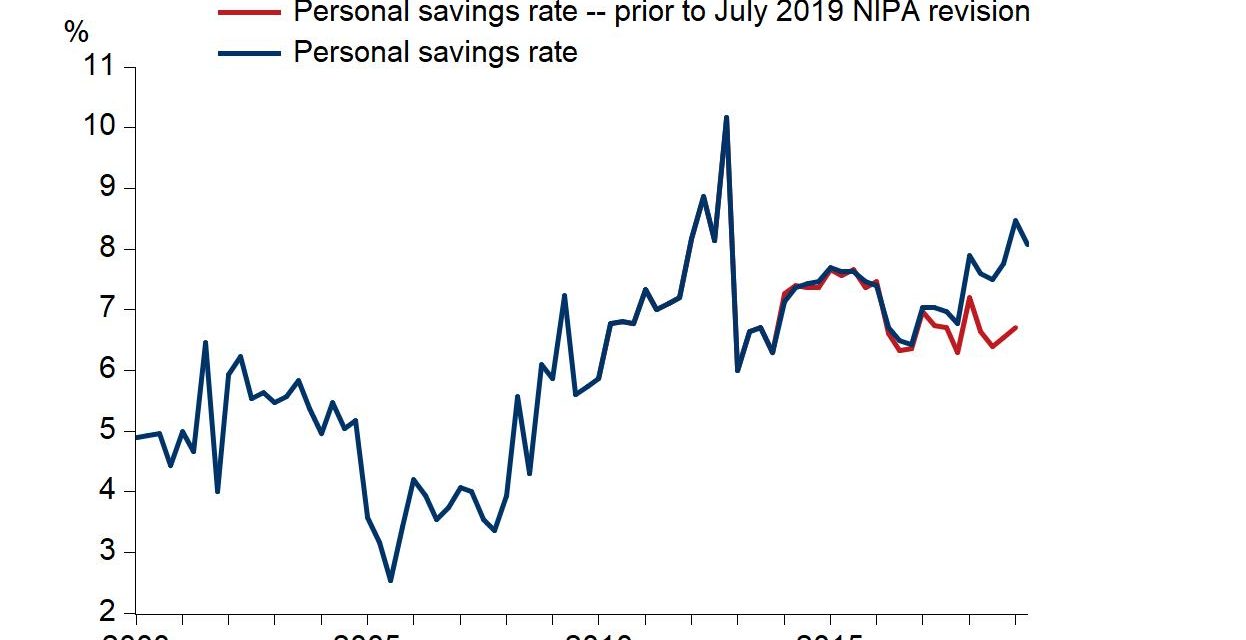
The consumer is doing better than originally reported. That’s pretty good since we already knew the consumer deleveraged this cycle and is recently experiencing solid real wage growth. The latest data revision shows Q1 corporate profits were revised down by $245 billion, but wages and salaries were revised higher by $228 billion. This explains why we think the revision was related to the exercising of stock option plans. NIPA counts employee stock ownership plans as income at the point of exercise rather than when the options are granted. This income is offset against corporate profits. The chart below shows the improvement in wages and salaries growth after the revision.
Personal Income Growth Now Quicker Than Spending Growth
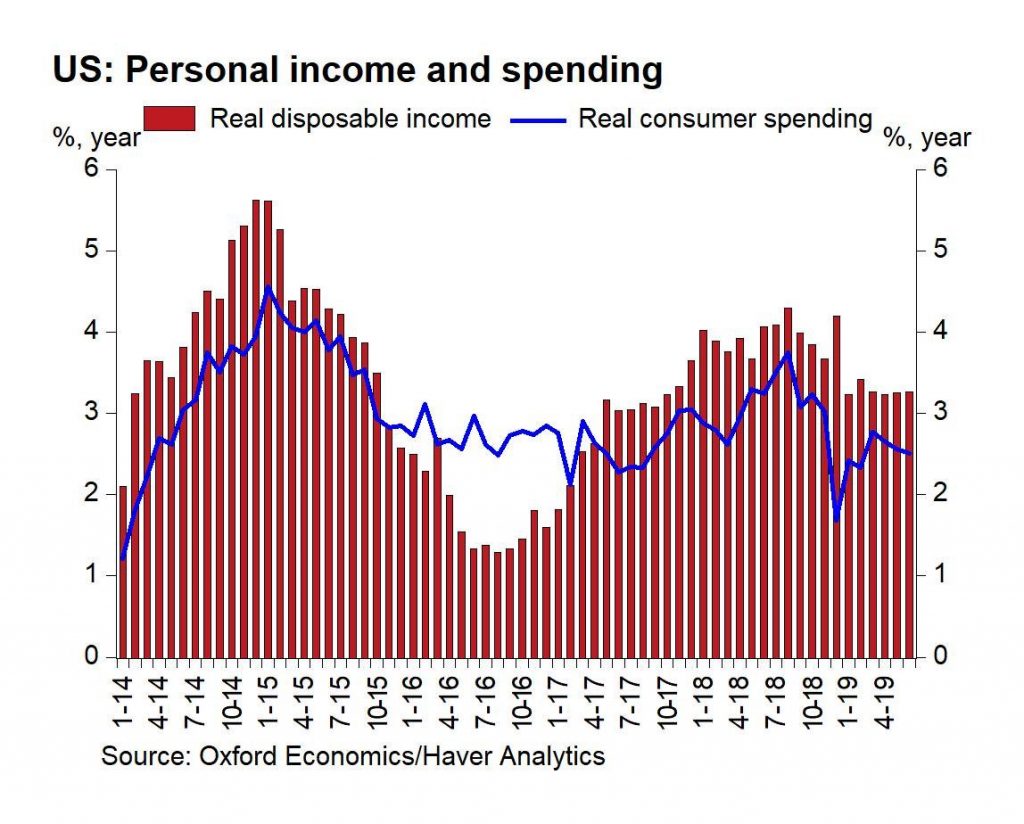
The revision is huge because it changes how the consumer looks. With prior data, real income growth was lower than real consumption growth. That’s obviously unsustainable in the intermediate term. It implies the consumer is racking up new debt to make its purchases. Taking on excess debt pulls growth forward; it’s not sustainable as the last mini-cycle showed. In the short term, it’s fine, but the clock is ticking on income growth to start accelerating or consumer spending will plummet and cause a recession.
As you can see from the chart below, during the 2015-2016 slowdown, real consumer spending growth was quicker than income growth. That didn’t last, allowing the consumer to replenish its savings.
It’s actually a good thing the savings rate temporarily fell rather than consumption growth because a decline in consumption growth could cause a recession. Specifically, the personal savings rate fell from 7.9% in February 2015 to 6.3% in December 2016. In the latest reading in June, the savings rate was a healthy 8.1%.
We needed to review that revision because it’s a wholesale change of how we look at the consumer. It probably matters more than the June data we will review now. In June, monthly personal income growth was 0.4% which beat estimates for 0.3%, but May’s growth was revised from 0.5% to 0.4%. Yearly growth was 3.3%. Monthly wages and salaries growth improved from 0.2% to 0.5%. Monthly consumer spending growth was 0.3% which matched estimates; the May reading was revised higher from 0.4% growth to 0.5%. Yearly consumption growth was 2.5%.
The consumer has room to increase its spending growth just to catch up to income growth. This could drive GDP growth for the rest of the year. It’s interesting to see this relatively low consumption growth given how strong the June retail sales report was. That bodes well for the potential for even higher retail sales growth. The 2nd biggest shopping period of the year, which is the back to school shopping season, is getting underway. This solid income growth suggests it will be a strong season.
On the slightly negative side, RedBook same store sales growth has been declining from its relatively high rate. In the week of July 27th, growth fell from 4.9% to 4.5%. At many points this year, the Redbook report has shown much higher growth than the hard data. Now let’s see if the two converge or if this is a sign retail sales growth will slow in July.
The Consumer Is Confident
Further boding well for the back to school shopping season is the sharp improvement in the Conference Board consumer confidence index in July. As you can see from the chart below, the index increased from the originally reported 121.5 to 135.7 which beat estimates for 125 and the high end of the estimate range which was 128.
The June reading was revised up to 124.3. This July reading is the highest of the year and puts the index near the high it hit last year. It was the 3rd highest reading in this expansion. This optimism spike was probably related to the trade negotiations between China and America.
Specifically, the present situation index was up from 164.3 to 170.9 and the expectations index was up from 97.6 to 111.2. As you can see, expectations spiked much more than the present index which makes it more likely that the index was helped by optimism on trade. The consumer’s assessment of the job market is probably the most important figure in this report because consumers have direct knowledge of the labor market. The percentage saying “jobs are plentiful” increased from 44% to 46.2% and the percentage saying jobs are “hard to get” fell from 15.8% to 12.8%. The percentage of consumers expecting business conditions to improved went from 19.1% to 24% and the percentage expecting improved short term income prospects went from 20.5% to 24.7%.
6.3% of consumers expected their income to fall over the next 6 months which is the fewest in 18.5 years. 2.3% expected to buy a new house within the next 6 months which was the highest percentage ever.
Inflation Stays Low
Headline June PCE inflation was 1.4% which missed estimates for 1.5% and met the negatively revised May reading; it was previously 1.5%. As you can see from the chart below, core PCE inflation was 1.6% which was an increase from the negatively revised May reading, which went from 1.6% to 1.5%. It missed estimates for 1.7%.
Core PCE inflation faced about a 2 basis point easier comp and increased 12 basis points from May. The Fed won’t have to worry about easy comps until next March. The recent peak was in July 2018 at 2.11%, so core PCE might fall next month.
The chart below shows the breakdown of the two components of core PCE inflation: acylical and procyclical.
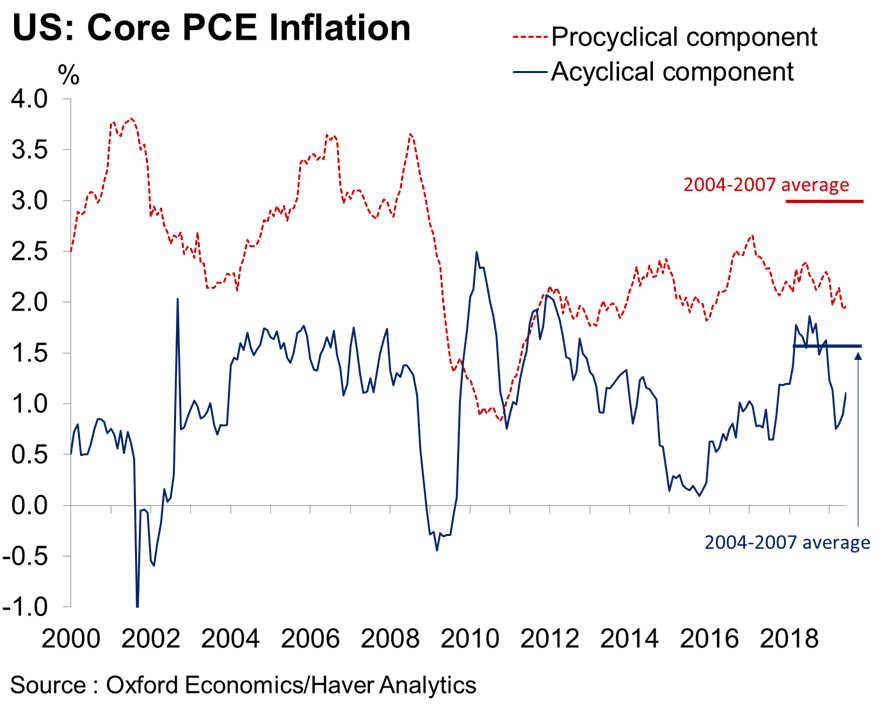
Acylical inflation is affected by industry specific factors more than the vacillations in the economy and procyclical inflation is sensitive to the economy. Acylical inflation and procyclical inflation are below their 2004-2007 average. If the economy starts generating inflation, at least the acylical component will suppress it a bit.
Conclusion
The consumer is doing better than was initially reported as the savings rate is higher and wages and salaries are higher. Real income growth is actually higher than consumption growth which means the consumer has room to see accelerated spending growth. Consumer confidence spiked in July which bodes well for retail sales growth. However, there has recently been a decline in Redbook same store sales growth (not saying it is weak). Core PCE inflation was 1.6% in June which gives the Fed room to cut rates. The Fed is being given that room because acylical and procyclical inflation are below their last cycle averages.
Have comments? Join the conversation on Twitter.
Disclaimer: The content on this site is for general informational and entertainment purposes only and should not be construed as financial advice. You agree that any decision you make will be based upon an independent investigation by a certified professional. Please read full disclaimer and privacy policy before reading any of our content.


