
UPFINA's Mission: The pursuit of truth in finance and economics to form an unbiased view of current events in order to understand human action, its causes and effects. Read about us and our mission here.
Reading Time: 5 minutes
In this article, we will discuss the revisions to the personal savings rate and GDP. Economists and investors spend a lot of time forecasting the advanced GDP report, but the truth is, the final reading sometimes is significantly different. That’s what makes studying the economy like playing darts blindfolded with a moving target. Even reported data doesn’t tell you the whole story.
Revisions Can Be Large
The latest information is usually the most pertinent to making intermediate term forecasts, but sometimes revisions tell a new story. To be clear, data revisions tell you new information about the cycle, not about secular trends. Student debt isn’t going to get revised away. Neither is income inequality or millennials struggling to buy houses. In the same token, even though everyone focuses on how the 2008 GDP reports were heavily revised lower, that’s a rare occurrence. The 2008 revisions don’t mean the economy can be in a big recession at any time.
Savings Rate Is Higher Than Originally Reported
The savings rate tends to be affected sharply by revisions. It is a plug in the data which means it’s a result of other surveys rather than a direct survey. The latest data revision is another example of a sharp revision affecting the savings rate. As you can see in the chart below, the savings rate is higher than it was originally reported.
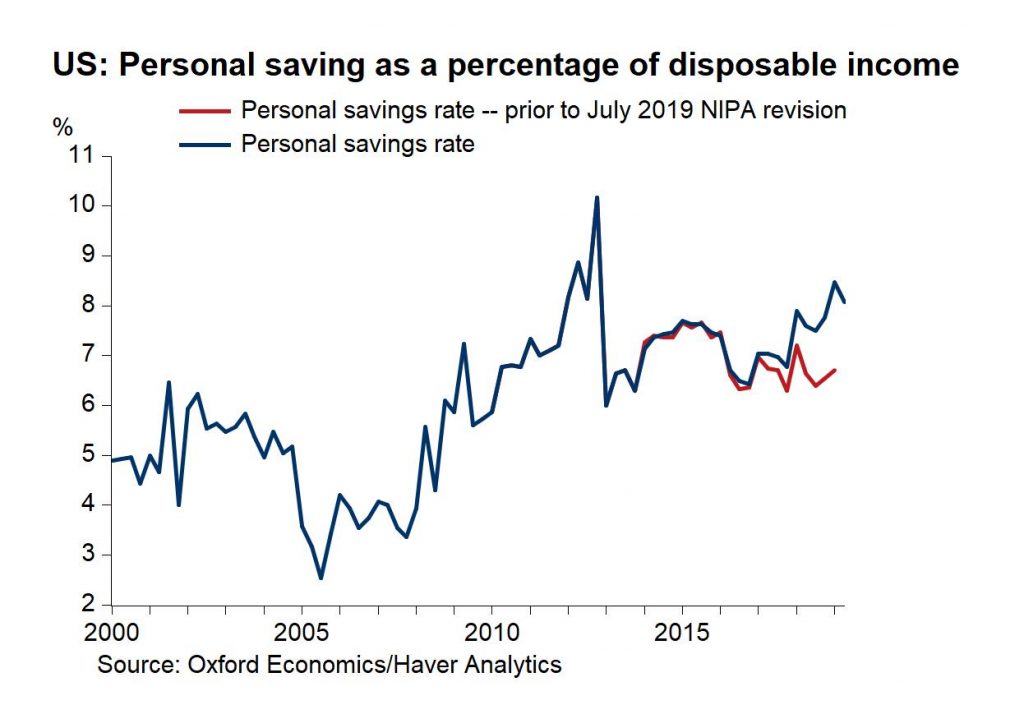
The increase in the savings rate due to data revisions is mostly related to higher compensation and net income. Perhaps, the upward revision to compensation may be related to employees exercising their stock options. Americans didn’t suddenly become better savers. The higher income calculation implies they saved more.
The savings rate is now at 8.1%. This improved savings rate supports the narrative that has been in place all cycle. The consumer’s balance sheet is in great shape because they have deleveraged and have a relatively decent savings rate. There is no consumer debt bubble. The consumer can keep going for years without catalyzing a recession. Obviously, the consumer will weaken if the labor market weakens; the point is the consumer won’t be the cause of economic issues. That’s great because the 2008 financial crisis, which was the worst recession since the Great Depression, was the result of the consumer being over-leveraged.
Suppressed Homeownership Rate
As we mentioned, this revision to the savings rate doesn’t change secular issues. One secular issue is home affordability. In a Fannie Mae poll, 24% of renters said they were “extremely likely” to ever own a home. That’s down 11% from 4 years ago. That’s what happens when shelter inflation outstrips overall inflation for many years. With increased student loan debt, it’s tougher for millennials to buy their first home. Also, home builders have shifted away from building starter homes to building more expensive homes which offer higher margins.
Less than 50% of homeowners are 18-44. That percentage was above 60% in 2009. To be clear, the aging population means young people will have less of a share. However, as you can see from the chart below, there is still a secular shift in the homeownership rate of younger and older millennials.
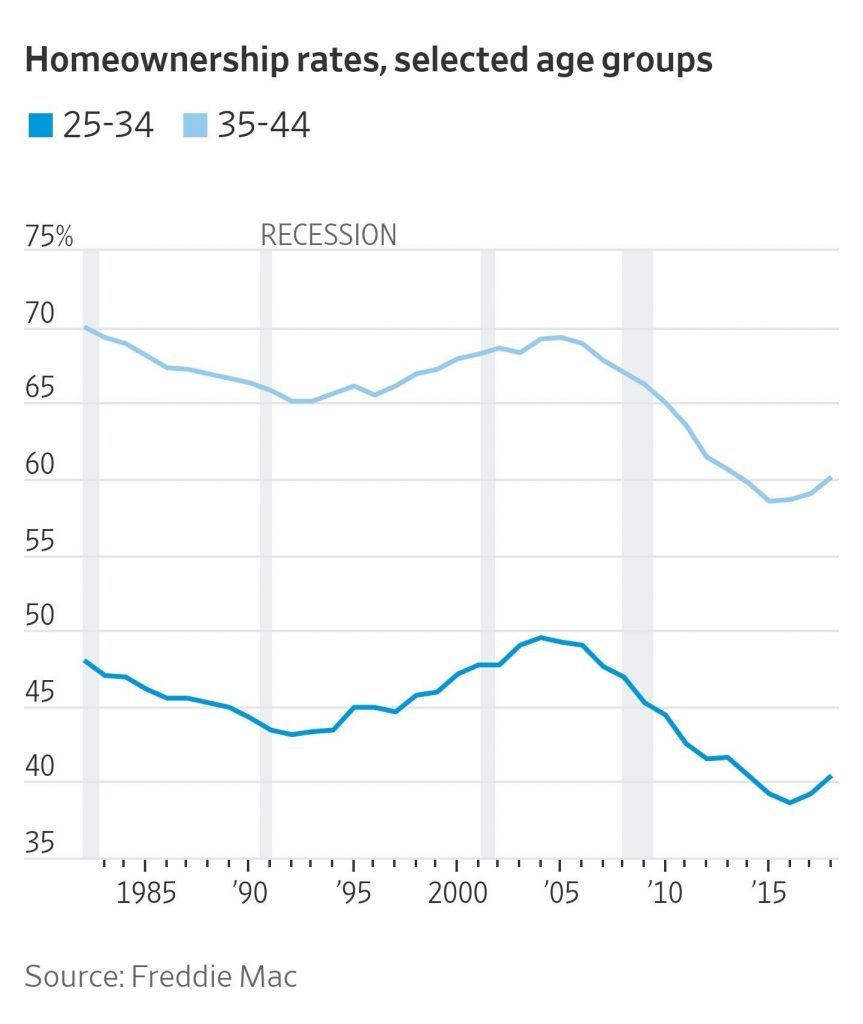
The percentage has increased a bit in the past couple years, but it’s still below where it was before the housing bubble started forming in the 1990s for those age groups.
New Slowdown
Sometimes revisions are just changes to old data that don’t matter. This isn’t an example of that as the past few quarters of GDP growth was revised dramatically. The chart below shows the unrevised and revised yearly GDP growth.
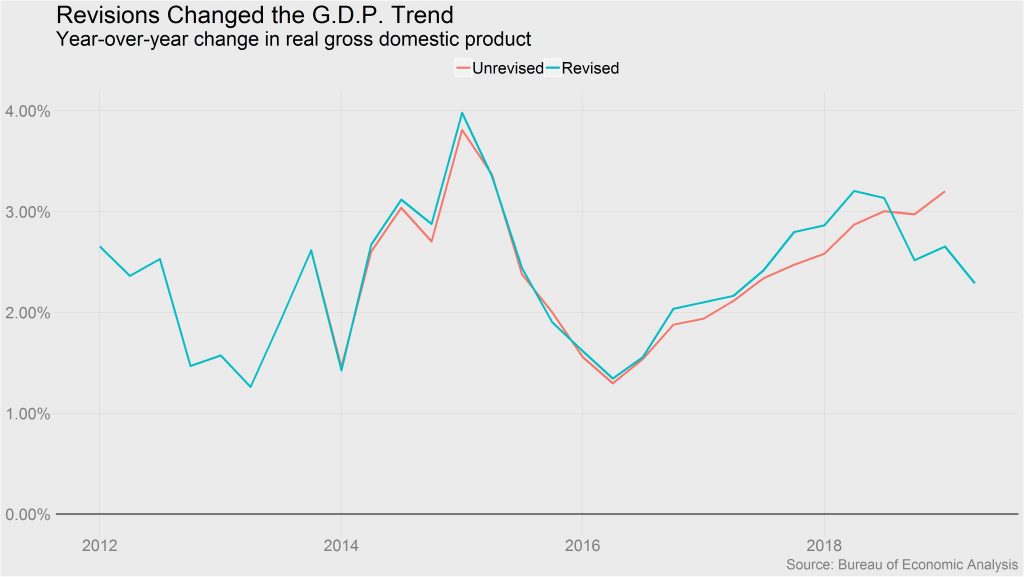
The change is huge because last quarter economists thought yearly growth was the highest in years. Now, it turns out that growth bump was a blip in a multi-quarter growth decline that continued in Q2.
We will point out that Q2’s growth was suppressed by net exports and inventory investment. If demand stays strong in the second half, headline growth will be much higher, and the trend will reverse. As for now, yearly GDP growth is mired in a slowdown that started in 2018. This chart looks a lot like the ECRI coincident indicator’s yearly growth. It told us what the revisions would look like before they happened. The ECRI leading index told you there would be a slowdown this year. It’s now showing 0% yearly growth which is an improvement from recent weeks.
Tracking The 10 Year Yield
If you’re trying to forecast nominal GDP growth, then follow the 10 year bond yield. As you can see from the chart below, the nominal GDP growth rate has been tracking the 10 year treasury yield if you lag the 10 year treasury yield by 3 months.
Obviously, the goal for investors is to make money, not predict GDP growth. You need to be ahead of the economy by a quarter or two to make money in the 10 year bond market.
Weak Global Economy
The global economy is highly important to forecasting the US economy because of the globalization of the past few decades and because the Fed is using the weakening global growth trend to justify rate cuts. As you can see from the chart below, in Q2 the global economy had its 3rd straight quarter of negative trade growth.
This is partially related to the trade war which still wages on even as America and China are talking.
The July flash manufacturing global PMI showed continued weakness. The headline PMI fell from 49.4 to 48.9 and the output PMI fell from 49.5 to 48.3. Both are in contractionary territory. The future output index has fallen the quickest since April as it’s down from 59.9 to 56.7. New orders and export orders fell from 49 and 48.8 to 48.6 and 47.9.
Conclusion
GDP and the savings rate were affected by revisions. The U.S. economy now is shown to be in a slowdown and the consumer is shown to be saving more. Either way, young adults are still having a difficult time affording housing. Plus, the global economy is mired in a deepening slowdown. The hope is a trade deal spurs global growth. If not, the Fed will continue to cut rates. The 10 year yield is forecasting continued economic weakness by being near 2%.
Have comments? Join the conversation on Twitter.
Disclaimer: The content on this site is for general informational and entertainment purposes only and should not be construed as financial advice. You agree that any decision you make will be based upon an independent investigation by a certified professional. Please read full disclaimer and privacy policy before reading any of our content.


