UPFINA's Mission: The pursuit of truth in finance and economics to form an unbiased view of current events in order to understand human action, its causes and effects. Read about us and our mission here.
Reading Time: 5 minutes
Investors who are bearish on the stock market often claim that they don’t know why stocks are moving higher. It makes them look silly because stocks move higher most of the time. The real question should be why stocks aren’t moving higher when they go down. It makes sense to be biased to the positive side when positive results usually occur. There’s a tendency for bearish investors to only read articles that support their negative biases. When they read a positive article, they mock it as impossible. Most bearish investors discuss the high leverage firms have without mentioning the earnings growth. They get agitated about how high valuations are without thinking about other methods of research which suggest stocks aren’t in a bubble territory. As we always say, the truth is generally in the middle. Finally, bearish investors overemphasize the importance of the Fed, blaming Yellen for every rally, even going so far as to discuss conspiracy theories that the US government is buying stocks. Maybe in the future, but not yet at least. The reason for this blame is that they can’t entertain the possibility that their thesis is wrong. It’s an unhealthy habit to ignore when you’re wrong. It’s a road to the poor house.
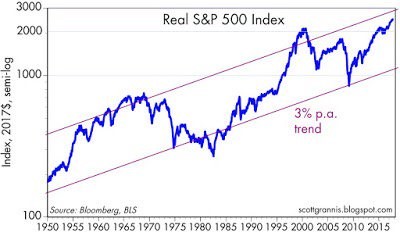
The chart below shows what we mentioned earlier; stocks usually go up. The S&P 500 on average outperforms inflation by 3% per year.
The S&P 500 index has a major positive tilt which is that it gets rid of companies that don’t meet its standards. It’s not fair to say the S&P 500 represents corporate America because it only represents the winners. This is why it’s tough to match its performance. If you were to individually buy the 500 companies in the S&P 500 and hold them for 10 years, you would underperform the index. Therefore, bearish investors are barking up the wrong tree when they say stocks are always in a bubble bound to fall. There will always be a correction coming, but there will always be a rally to follow that.
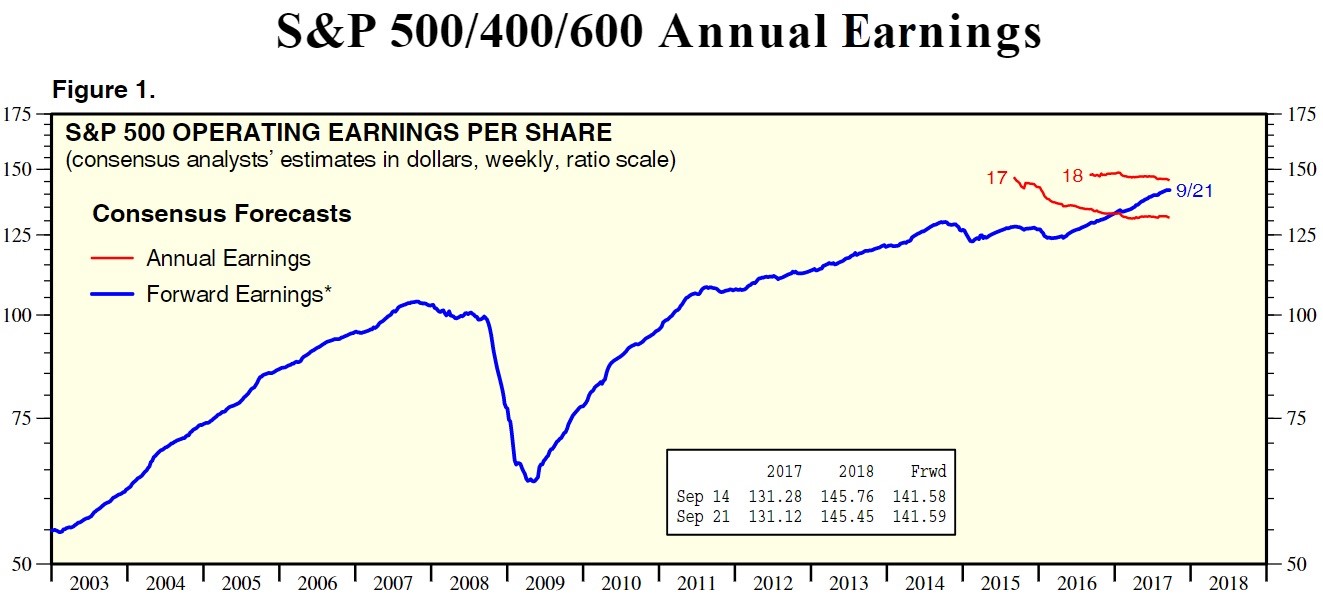
Bearish investors tend to focus too much on systematic risks instead of looking at the bottom up results which are rosy as you can see in the chart below.
There will always be risk of war or bad weather, but you need to multiply the possible weakness by the probability of it occurring to get a proper perspective on where equity valuations should be. When someone asks how stocks can move up when it seems the world is going to hell in a handbasket, the answer is earnings growth. Many bears cherry pick firms which have bad results, but overall growth has been positive. It’s time to audit the bears’ thinking so that only the ones with the best arguments get reviewed. Many rely on lazy analysis. People follow these lazy points because they love contrarians who go against the mainstream thought process and reporting. There’s no question that going against mainstream ideas is a reasonable track to follow, but don’t disagree just to disagree. You need a powerful argument to bet against stocks or you will be in trouble.
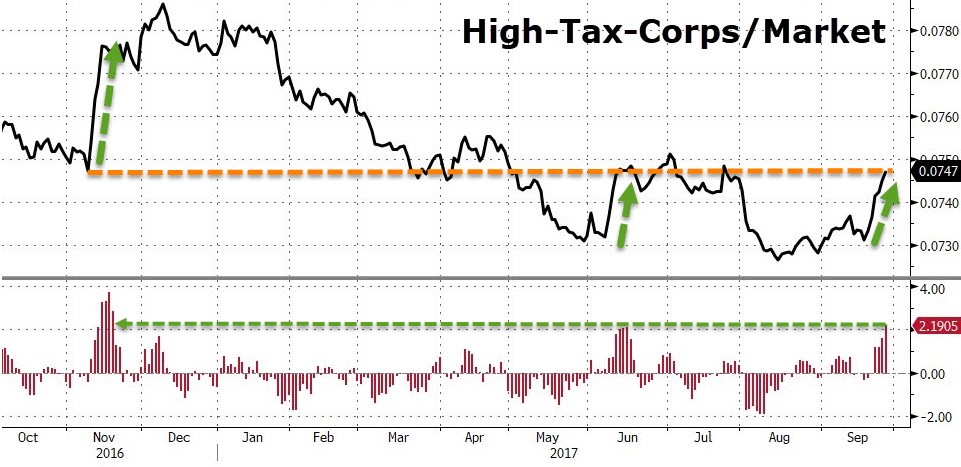
One of the most prevalent myths that is going on in bearish circles is that stocks have been rallying for months on the prospect of tax cuts. Because stocks sometimes rally when headlines about tax cuts are in the news, and because stocks are having a good year without even a 3% correction, bears blame the entire rally on tax cut hopes. If the entire S&P 500 gain this year was because of tax cuts, that would be a reason to sell because tax reform might not happen and even if it does, it won’t be a big decline in the effective rate paid because firms already pay lower rates than the statutory rate. The devil is in the details, but we don’t have the details because there’s no bill, so it’s tough to get any further with that discussion. The point is that stocks haven’t been rallying all year on the hope of tax cuts.
The chart below provides proof of that because it shows stocks which would benefit the most from tax cuts (high taxed corporations) are down year to date. There have been a few rallies which have been sold. This pessimism is logical because tax reform is pesky. The GOP only has 2 votes to spare in the Senate and the party is severely splintered.
Permabearish investors who sell fear instead of real investment advice which can make you money like to cherry pick data points, only showing the poor results such as auto sales and restaurant same store sales. Then they use poor results as proxies for the overall economy even though there’s much more positive indicators than negative.
The chart below is often used to scare people as it is paired with the jobless claims, making the point that increased credit card delinquencies are signaling a recession coming soon.
As you can see, in the mid-1990s delinquencies increased and there wasn’t a recession for about 5 years. The current delinquency rate is below the rate it was at any time between Q1 1991 and Q2 2013, so it’s hardly a reason to panic.
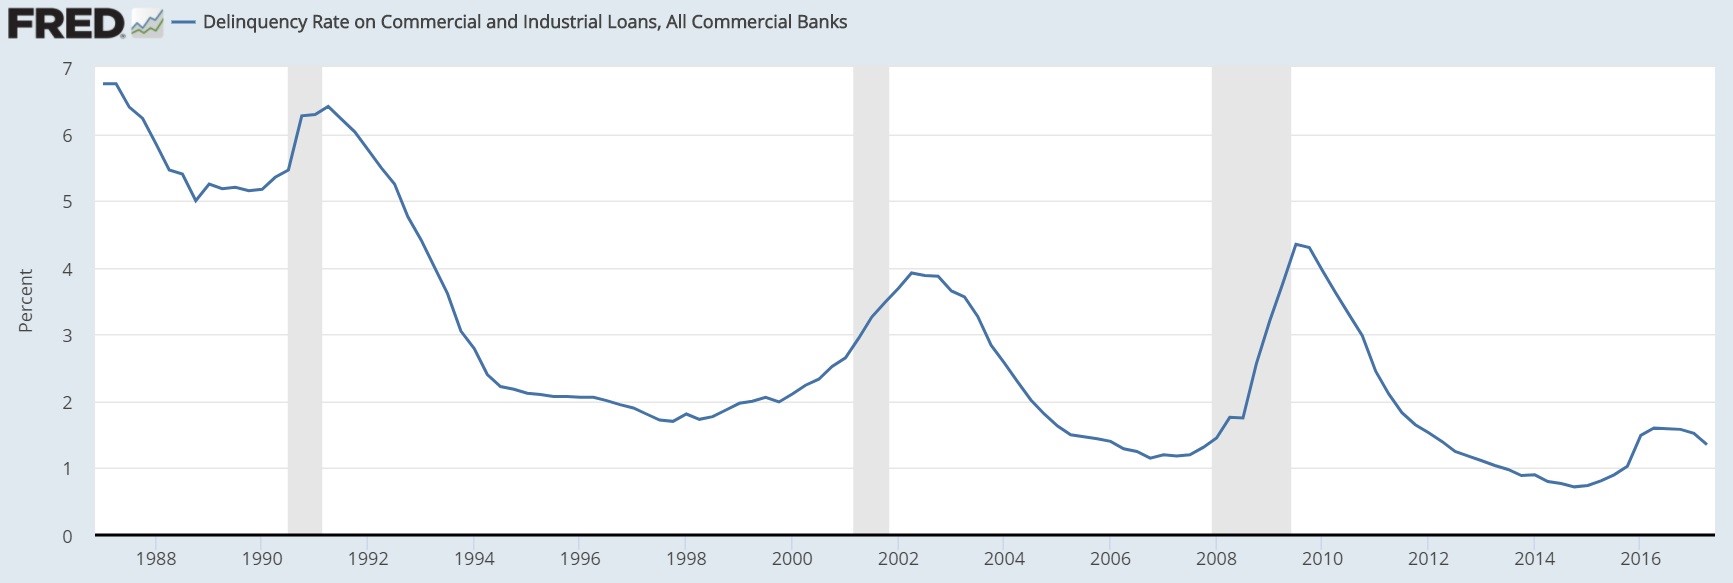
One chart which bearish investors won’t show you is the commercial and industrial delinquency rate.
The rate spiked higher in 2015 and 2016 before falling lower in 2017. The C&I default rate has been a better predictor of recessions than the credit card default rate. The economy neared a recession in the beginning of 2016, but it recovered from the brink. The credit card rate missed this weakness and seems to be sliding along the bottom of the cycle.
Conclusion
Stocks usually move higher; it’s a fact of life that the permabears don’t want to admit as they fear a crash like 2008 coming again even though there’s no immediate sign of one occurring. While valuations are high, it doesn’t mean they can’t become higher. Earnings expectations are high and C&I default rates are declining. It’s best not to be a permabear nor a permabull because markets are dynamic and the facts are always changing. The goal of this article is to help you find arguments to thwart those investors trying to sell fear instead of good advice. They always have endless charts with cherry picked data to support their claims which are usually made with a religious zeal.
As the famous line goes:
“There are three kinds of lies: lies, damned lies, and statistics.”
Have comments? Join the conversation on Twitter.
Disclaimer: The content on this site is for general informational and entertainment purposes only and should not be construed as financial advice. You agree that any decision you make will be based upon an independent investigation by a certified professional. Please read full disclaimer and privacy policy before reading any of our content.


