UPFINA's Mission: The pursuit of truth in finance and economics to form an unbiased view of current events in order to understand human action, its causes and effects. Read about us and our mission here.
Reading Time: 5 minutes
Earnings growth is much more important than the financial media gives it credit. There are often stories about geopolitics, while there few about the rate of change of analysts’ estimates outside the reporting season. The true driver of equity performance, which is future earnings estimates, are very boring and are not as easy to write about as stories which are more entertaining. However, some of the most nuanced ideas and insights arise not from reading popular stories, but discussing mundane topics like future earnings estimates. As an investor, the key question you should be asking is how every event and data point affects earnings. This will help guide appropriate and timely decision making in markets.
Peak Earnings Growth In Q3
The Earnings Scout table below shows the earnings growth breakdown by sector in each quarter since Q2 2016.
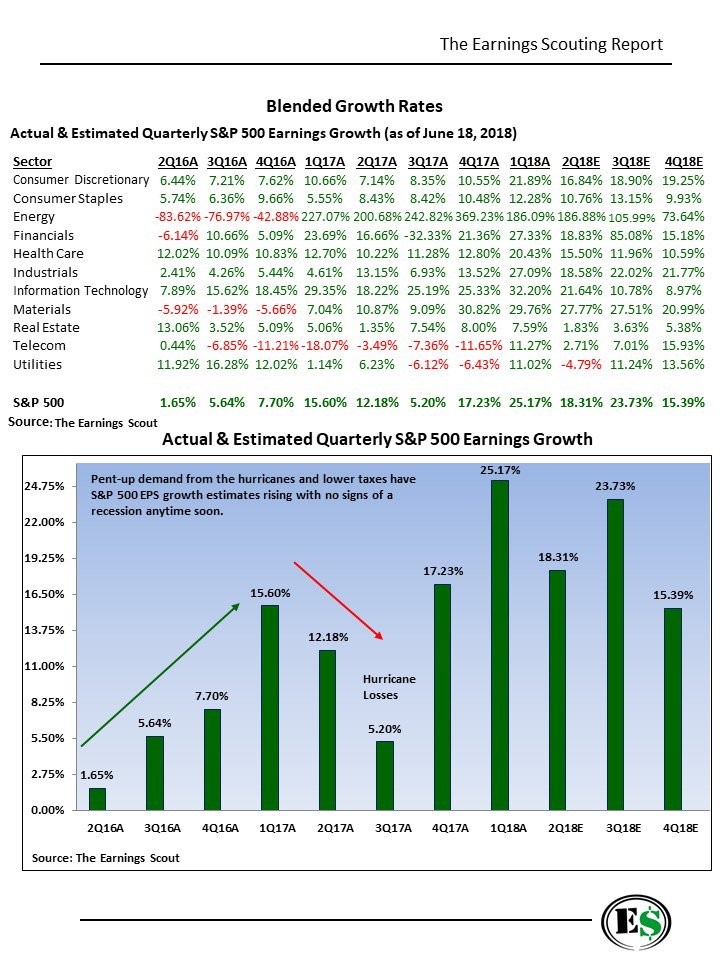
Source: The Earnings Scout
It’s clear that energy sector earnings are being driven by easy comparisons since losses mounted in 2016 and earnings were still significantly below their potential in 2017. Even though growth decelerated in 2018, energy still will have a big factor on the overall earnings results because the weighting of energy has increased. In Q2 2017 energy was only 2.75% of S&P 500 earnings and in Q2 2018 energy is expected to be 5.78% of S&P 500 earnings.
The most notable factor in the bottom chart from the Earnings Scout is that the hurricanes caused growth to slow in Q3 2017 followed by a large increase in Q4 since some demand was pulled forward as purchases were made to recover from the hurricanes. The entire theory that stocks will crash because earnings growth will slow in Q4 is ridiculous since last year’s results were distorted by the storm. It’s not that Q4 will suddenly slowdown; there’s simply a change in the comparisons. Another small point to keep in mind is the Q3 results will most likely beat estimates, a phenomenon we explained in Myths & Facts: Fundamental Investing. This is why we say Q3 will be above Q1 growth even though the current estimate is lower.
Is Growth Sustainable?
Oddly, even though the tax cuts are considered a shortcut to real economic growth, they are more sustainable than cyclical and one-time changes. The benefits of the tax cuts will be maintained as the corporate tax rate will stay the same (for now at least). This is unlike the changes in economic growth because of temporary one-time events like hurricanes or cyclical phase changes such as from 2016 to 2017 where economic growth improved.
If the tax cuts are stimulative because increases in capex and consumer spending drive growth, that will diminish over time. The U.S. economy is seeing improvement in Q2 while most other countries such as China, other emerging markets, and Europe are seeing weakness. However, if the tax cuts are allowing the Fed to raise rates quicker and that is pushing the dollar higher and emerging markets lower, does that count in favor of tax cuts helping U.S. growth outperform? You would think pushing down growth in other areas of the world wouldn’t count as out performance.
It’s genuinely difficult to understand the cyclical effects of the tax cuts because of how dynamic the economy is since there are always countervailing trends. For example, slowing Chinese growth could be hurting Europe as China is Germany’s largest trading partner while Germany is Europe’s largest economy. Germany’s largest export product is cars and Chinese car sales fell for the first time in 3 years in Q2 2018. If the U.S. is avoiding such trouble, that could be an explanation for why growth is outperforming, besides stating that this is all a result of US tax cuts.
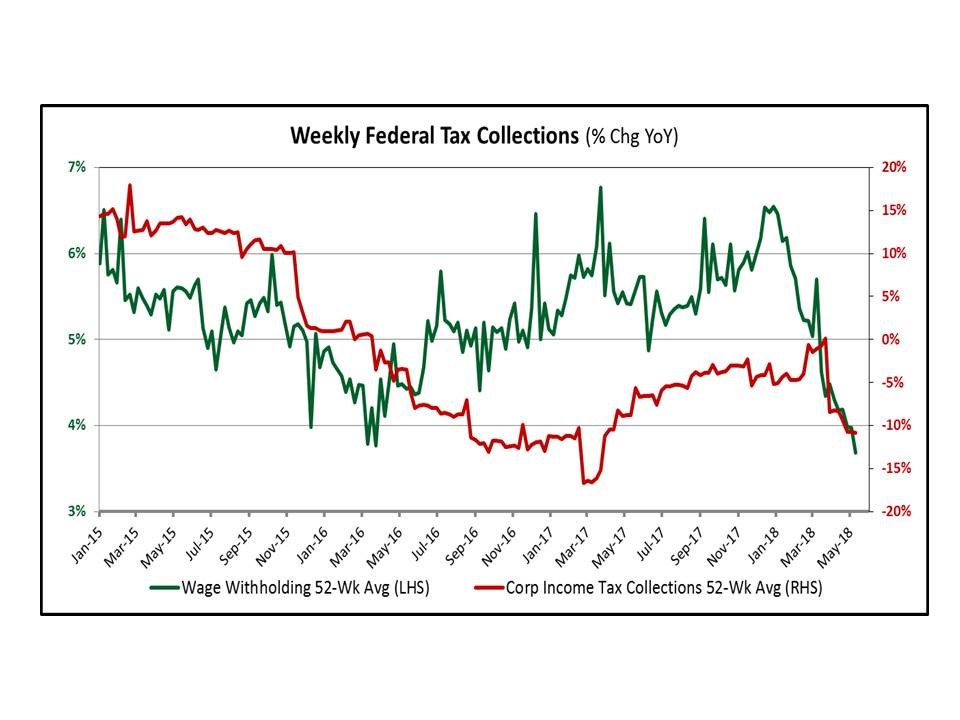
The weekly federal tax collections make one thing clear, Americans and US businesses are paying lower tax rates.
Source: Twitter @DonDraperClone
Even as the jobs market expands and nominal wages have had accelerated growth, the 52 week average of year over year wage withholdings are down almost 15%. Corporate income tax collections are down about 10% year over year even as the May NFIB survey shows small business earnings have never improved this much since the survey was started in 1973. At the same time S&P 500 profit growth was 25.17% in Q1 2018.
Is The Energy Rebound Driving Growth?
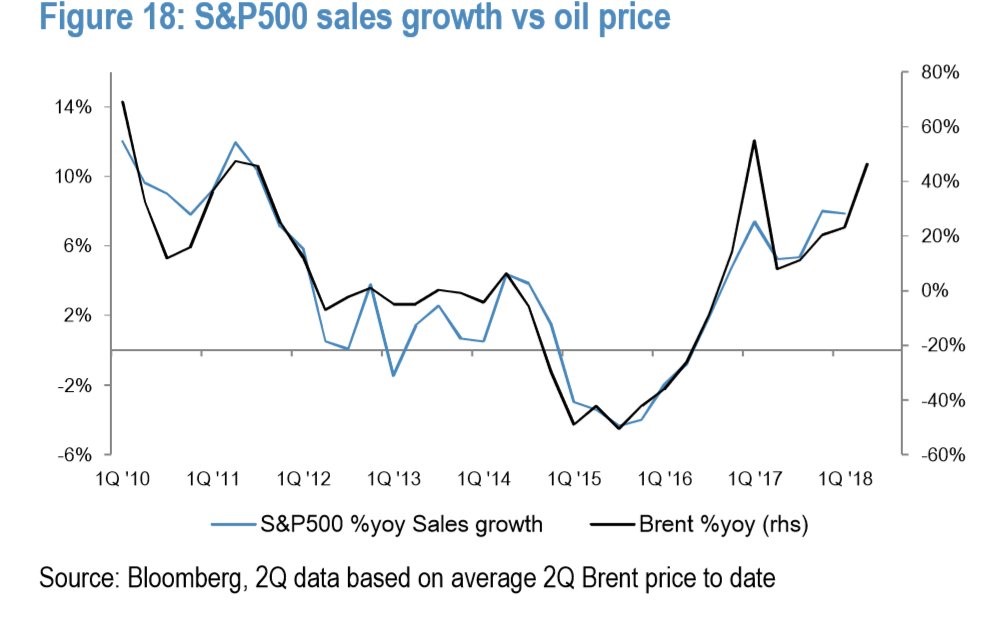
One aspect we’ve mentioned a few times this year is how oil price gains have helped increase GDP growth. Clearly, that doesn’t go along with the narrative that the economy is solely outperforming because of the tax cuts. In the May industrial production report, mining production growth was 12.6% year over year and utility production growth was 4%. However, this report was different from April because overall growth was weak due to the drop in auto sales. Manufacturing growth was only 1.7%.
The chart below shows the S&P 500 sales growth compared to the price of Brent (oil) year over year. As you can see, since 2010 the two have been highly correlated, showing how important a role energy plays in economic growth. Sometimes increasing oil prices signal that economic growth is expanding and when demand weakens it signals that the economy is weak. However, the price has been mostly driven by supply since late-2014, potentially indicating the wide vacillations in prices have an outsized effect on sales growth and economic growth. One notable point is that American WTI has recently diverged from Brent because of pipeline limitations in America and the potential for Chinese tariffs on US oil.
Source: Twitter @TeddyVallee
Earnings Revisions Are What’s Important
The most forward looking investors have the best understanding of what’s happening in the economy because equities trade on expectations of the future, not what occurred in the past. The bleeding edge of earnings data are revisions. As you can see from The Earnings Scout chart, the revisions were strongly negative in January while stocks rallied, signaling you should sell stocks. The earnings revisions were then positive in February and March while stocks plummeted, signaling you should have bought stocks.
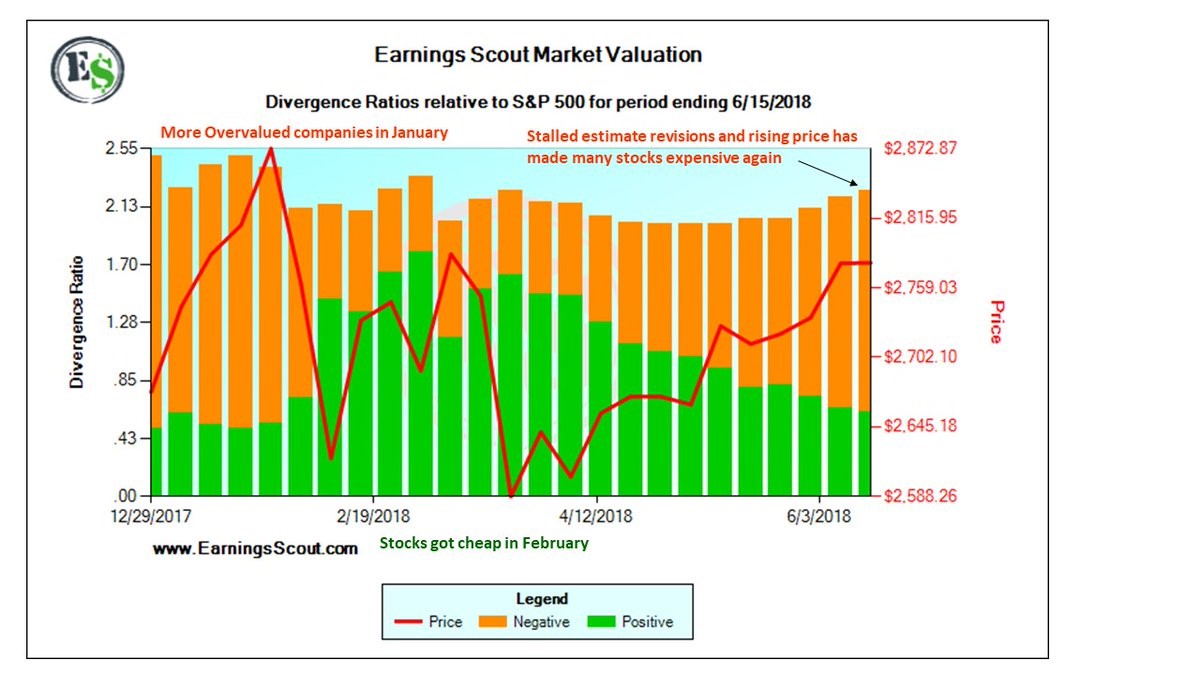
Source: The Earnings Scout
Now stocks are up again while the revisions are negative, suggesting that the near term indicator is likely range bound or slightly negative equity markets. However, the large earnings growth shown in the first chart of this post shows this decline will be a correction rather than a bear market.
Conclusion
We aim to provide a balanced view of the markets in order to assess the highest probability outcome. The year over year earnings growth comparisons explain why growth will peak in Q3; it doesn’t imply Q4 will be weakening. The tax cuts will continue to improve margins in a sustainable manner, but if they are also causing a cyclical improvement, that will fade. The first step to understanding if tax cuts are driving growth is to see whether the heightened Q2 growth rate is maintained in the 2nd half of 2018 and without amplification from oil prices.
Have comments? Join the conversation on Twitter.
Disclaimer: The content on this site is for general informational and entertainment purposes only and should not be construed as financial advice. You agree that any decision you make will be based upon an independent investigation by a certified professional. Please read full disclaimer and privacy policy before reading any of our content.


