UPFINA's Mission: The pursuit of truth in finance and economics to form an unbiased view of current events in order to understand human action, its causes and effects. Read about us and our mission here.
Reading Time: 5 minutes
MBA purchase applications continues to be one of the few housing data points that shows positive yearly growth. It has been positive almost the whole year. It stayed that way in the week of July 19th, even though weekly growth was negative. Specifically, the composite index fell 1.9% after falling 1.1%. The purchase index fell 2% after falling 4%, but was up 6% yearly. Finally, the refinance index was down 2% after rising 2%.
New Home Sales: Negative Revisions
The June new home sales report was terrible because it missed estimates and the prior 3 months were all revised lower. The cycle high of new home sales is firmly entrenched at 715,000 in November 2017. As you can see from the chart below, the March reading was revised lower by 12,000 to 693,000.
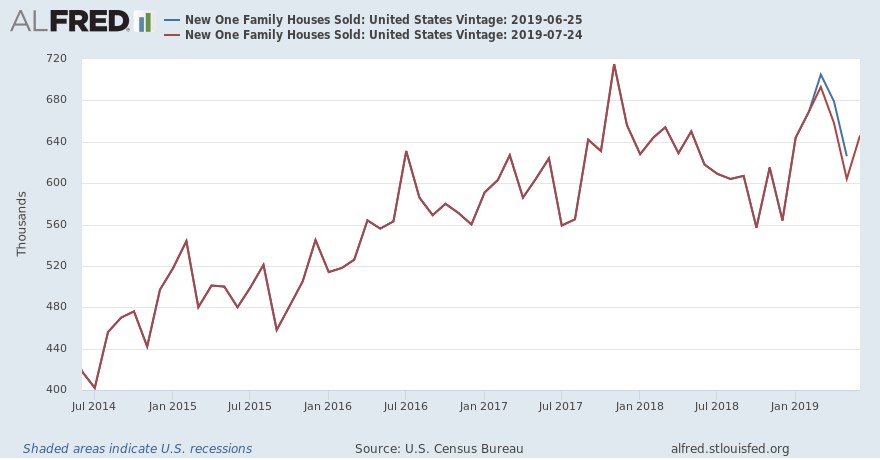
The April reading was even worse as it was revised down 21,000 to 658,000. Finally, the May reading was revised down 22,000 to 604,000. That really puts a damper on the odds of Q2 real residential investment growth being positive.
The June reading improved to 646,000, but it missed estimates for 660,000. The 3 month average is 636,000 which is significantly below the 2019 peak of 673,000 in April. Median new single family home prices were $310,400. That’s 0% yearly growth. Obviously, new homes cost a bit more than existing homes. In June they cost $24,700 more. On a non-seasonally adjusted basis, prices peaked $343,400 in November 2017. Yearly price growth is nowhere near the FHFA reading of 5% (in May) or the price growth in existing homes which was 2.7%.
At least current price growth is better than the -10.2% growth rate in November 2018. Late last year was a mini-housing recession. There isn’t much room for sales and starts to decline in a real recession because results have been so weak in this expansion. As you can see in the chart below, the current population adjusted new home sales is very close to previous cycle troughs.
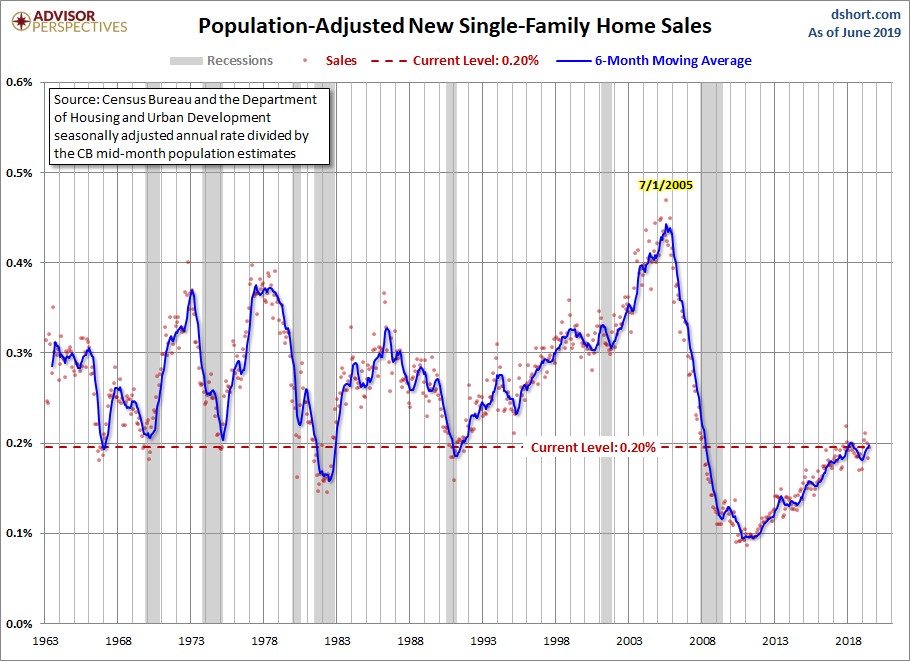
Population adjusted sales are not likely to get to the 2005 peak anytime soon, but getting near previous cycle peaks is possible.
Mixed Markit PMI Report: Manufacturing Weakness
This July Markit flash reading had some incredibly weak data points for a report where the composite hit a 3 month high. Let’s delve into the interesting results. The negative headline is that the manufacturing PMI fell from 50.6 to 50 which is a 118 month low. This is only the flash reading, but if the final reading is similar, the ISM manufacturing PMI will probably fall as well. You can see in the chart below how the 2 are correlated.
Remember, the new orders index in the ISM manufacturing report affects the leading indicators index. We mentioned how it could improve in July, but that looks less likely now with the weak Richmond Fed report and this weak Markit flash reading coming out. Furthermore, the manufacturing output index fell from 51.2 to 48.9 which is a 119 month low. Even though the PMI is at 50, output fell at a quarterly rate of 1%. It’s worth noting that in June, yearly manufacturing production growth was 0.5% which is nowhere near the 2015 trough of -2%.
Composite Improves, But Weak Nuggets Are Obvious
As we mentioned, the composite index hit a 3 month high. It went from 51.5 to 51.6 because the service sector PMI improved. The service sector PMI also hit a 3 month high as it increased from 51.5 to 52.2. The service sector is much larger than manufacturing. Manufacturing is more cyclical. One reason this 10 year business cycle has had 2, going on 3, slowdowns is because of the volatility in the manufacturing sector. Some wonder if the American business cycle has softened because manufacturing is shrinking. The labor market is increasingly reliant on jobs at warehouses for companies like Amazon.
Now let’s get to the details of this report of which there are many weak points. As you can see from the chart below, the employment index fell to a 27 month low even though the service sector, which employs the most workers, saw an improvement in business activity.
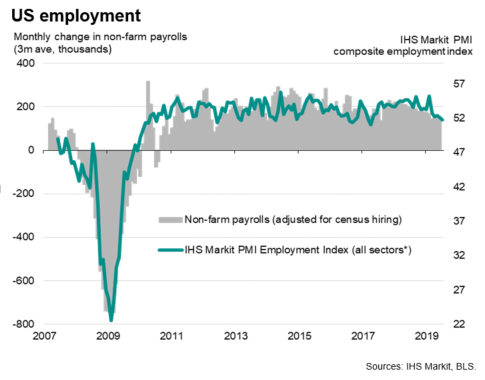
This employment reading is consistent with 130,000 jobs created in July. That’s below the average monthly of 150,000 in Q2 and 200,000 in Q1. The July labor report comes out on August 2nd. Even though 130,000 jobs added would be below the amount in June, the stock market would probably shake off that modest weakness since it’s near what it takes to keep up with population growth. Modest weakness might even be applauded because it would make rate cuts more likely. This weakness in the employment reading was spurred by the lowest ever business optimism print. This index was created in July 2012.
This report had 2 categories that hit their record low. The other was service sector business expectations for the next year. It fell to the lowest level since October 2009 when it was created. Discounting was the highest since February 2016. No wonder why firms weren’t optimistic about the future.
The manufacturing details were even worse. Its PMI weakness was caused by global uncertainty and the auto industry. Specifically, production volume, employment, and the decline in stocks of purchases hurt the index. Production growth fell by the most since August 2009. Finally, international new work fell at the quickest rate since April 2016. That might be related to the global slowdown or the trade war.
1.6% GDP Growth In Q3
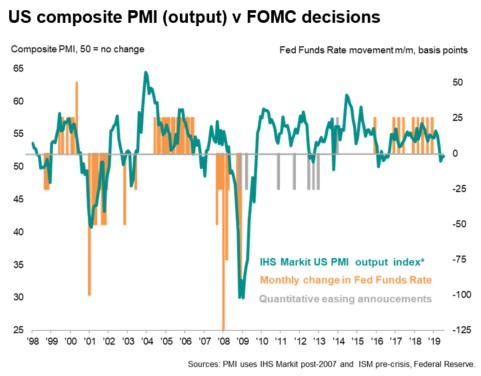
This PMI is consistent with 1.6% which is above Q2’s average of 1.5%. To be fair, Q2 GDP growth is expected to be from 1.5% to 2%, so Markit is a little bit more negative than most estimates. As you can see from the chart below, the composite PMI is now barely in line with rate cuts. The Fed has domestic data to base the July rate cut on.
Conclusion
Stocks rallied to new record highs on the latest earnings reports on Wednesday, but let’s not lose sight of the weak new home sales report and the very weak business confidence reading. The saving grace is that the service sector is outperforming the manufacturing sector which is seeing output declines of 1% if you look at the flash Markit PMI.
Have comments? Join the conversation on Twitter.
Disclaimer: The content on this site is for general informational and entertainment purposes only and should not be construed as financial advice. You agree that any decision you make will be based upon an independent investigation by a certified professional. Please read full disclaimer and privacy policy before reading any of our content.


