UPFINA's Mission: The pursuit of truth in finance and economics to form an unbiased view of current events in order to understand human action, its causes and effects. Read about us and our mission here.
Reading Time: 5 minutes
The housing market continues to stumble along with negative growth in the first half of the year even though there are low interest rates, the unemployment rate is low, and real wage growth is high. In the 2nd half of 2019, growth will improve, but that shouldn’t be seen as a victory since results were poor late last year. The environment late last year was like now except interest rates were higher. It’s disconcerting that slightly above the lowest rates in history can bring the housing market down. That shows how unaffordable prices have become. The data hasn’t rebounded yet, so home price growth will continue to fall. Price growth can even go negative if the unemployment rate increases.
Existing Home Sales Miss Estimates
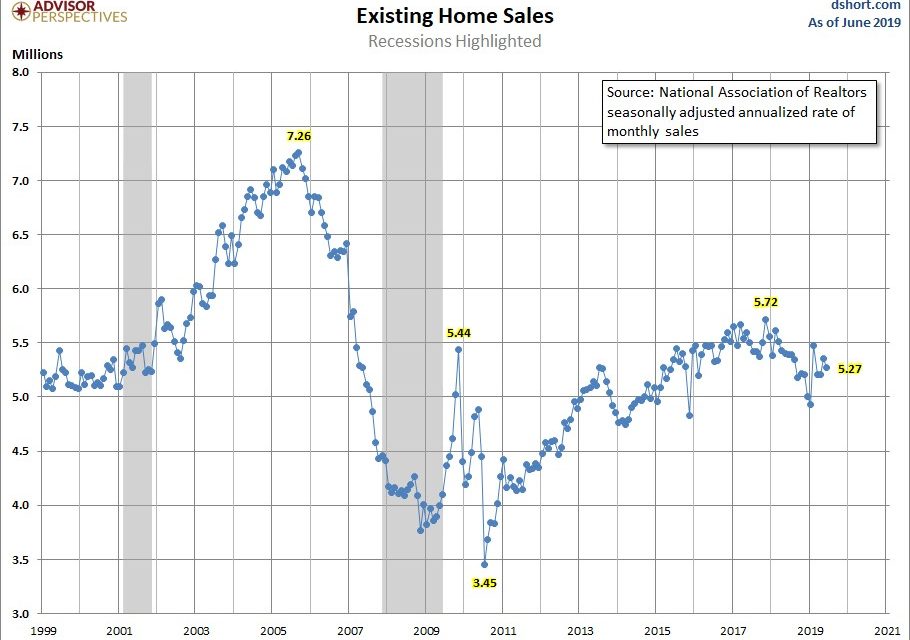
The June existing home sales report came in at 5.27 million which missed estimates for 5.32 million and fell from 5.36 million as you can see from the chart below.
This report counts the largest part of the housing market. That’s what makes it important even though it doesn’t affect GDP. Monthly growth fell from 2.9% to -1.7% and yearly growth fell from -0.7% to -2.2%. This report is roughly in line with the 3 month average, but also in line with sales totals in 2015.
On a yearly basis, single family existing home sales fell 1.7% to 4.69 million and condo sales fell 6.5% to 580,000. Sales fell 4.2% in the Northeast, 1.6% in the Midwest, 0.4% in the South, and 5.2% in the West. Median prices were up 4.3% yearly to $285,700. That’s higher than the price growth in the Case Shiller index, but lower than the FHFA home price index’s growth. However, neither have data out for June yet. We will review the May FHFA report next. Unsold inventories increased from 1.91 million to 1.93 million which is 4.4 months of supply instead of 4.3 months.
As you can see from the chart below, cash sales fell from 22% last year to 16%. Cash sales were 19% of existing home sales in May.
There has been a decline in international investment in American housing especially from the Chinese. That could explain the decline in sales to investors from 13% to 10%. Even though the percentage of first time buyers was up 4 points, it’s not as if first time buyers are flocking to the market because remember the overall reading was down 2.2%. That’s not to say these buyers aren’t helped by the decline in interest rates. As of July 18th, 30 year fixed rates were 3.81%.
FHFA Housing Market Price Growth Falls
Both the FHFA housing market index and the Case Shiller index have been showing declines in price growth. FHFA price growth has been higher. It’s best to compare it to itself rather than the lower Case Shiller reading. The May FHFA index was up 0.1% monthly which missed estimates for 0.3% growth and was the weakest growth rate since January 2017. Yearly growth fell from 5.3% to 5% which was the lowest growth rate since March 2015. Keep in mind, these price growth readings are much delayed, not that if we had data from July it would show a sudden upturn in growth.
The chart below shows the price growth by regional division versus last year’s growth.
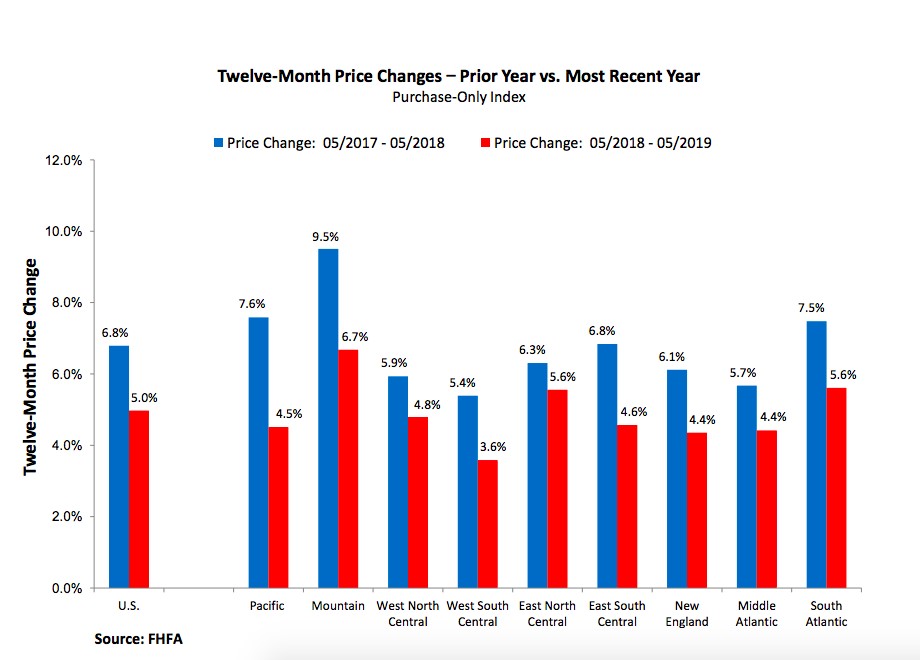
Many of the hottest areas have seen a trend reversal since 2018. The hot housing market that was the Pacific has seen price growth fall from 7.6% to just 4.5%. It went from 0.8% above the national growth rate to 0.5% below it. In that time frame, growth in the Middle Atlantic fell just 1.3% as its growth rate got closer to the national average. Hot areas in 2018 like Seattle have seen price growth plummet, while cooler areas like New York haven’t had as big of a drop. We will be watching Seattle, Las Vegas, and Denver the closest in next Tuesday’s May Case Shiller home price report.
Dramatic Decline In Richmond Fed Index
The massive decline in the July Richmond Fed manufacturing index is interesting because this weakness wouldn’t have been surprising if it was the first regional Fed index to come out because manufacturing sentiment has been weakening for a few months. However, the July Empire and Philly Fed indexes increased sharply which raised expectations. Now we have 2 positives and 1 negative. The Richmond Fed index even disagreed with itself as we will discuss.
The Richmond Fed index fell from 2 to -12 which missed estimates for 5 and the lowest estimate which was 3. As you can see from the chart below, that’s lower than 92% of all readings.
It’s borderline recessionary and the worst reading since January 2013. In the index, the local business conditions category fell from 7 to -18 which is the worst monthly decline ever. The backlog of orders index was -26 which was the worst reading since April 2009. Shipments and volume of new orders fell from 5 and -2 to -13 and -18.
This report disagreed with itself because the current index was poor and the expectations readings were fine. There is no overall expectations index. However, you can get an idea of what it would be by looking at shipments, new orders, and employment because they make up the current index. All those expectations categories improved. Shipments and volume of new orders were both up 9 points to 32 and 36. The local business conditions index more than doubled from 11 to 25. Whatever troubled local conditions in July is expected to go away in the future.
Earnings About To Head Higher
Earnings season appears to be going solidly as on Tuesday Coca-Cola, Chipotle, and United Technologies all beat their revenue and EPS estimates and raised full year guidance. Average EPS growth from the first 138 S&P 500 firms to report earnings was 4.15% and sales growth was 3.51%. Q3 EPS estimates aren’t falling as quickly as Q2 estimates did which didn’t fall as quickly as Q1 estimates. There’s already a mini trend of less declines in estimates. As you can see from the chart below, the earnings revisions factor tends to do really well 13 weeks after the first Fed rate cut of the cycle.
Conclusion
We got more of the same news from the housing market as existing home sales was within its recent range and home price growth fell again. The Richmond Fed manufacturing reading was terrible. Don’t be alarmed as the expectations categories were fine. We follow the current reading the closest, but a big increase in the expectations for local business conditions doesn’t exactly jive with a recession in manufacturing. Finally, earnings revisions have historically improved in the weeks following the first Fed rate cut of the cycle.
Have comments? Join the conversation on Twitter.
Disclaimer: The content on this site is for general informational and entertainment purposes only and should not be construed as financial advice. You agree that any decision you make will be based upon an independent investigation by a certified professional. Please read full disclaimer and privacy policy before reading any of our content.


