UPFINA's Mission: The pursuit of truth in finance and economics to form an unbiased view of current events in order to understand human action, its causes and effects. Read about us and our mission here.
Reading Time: 4 minutes
The chart below is probably the weirdest chart in all of finance because it shows there are more bears than bulls among individual investors while the stock market is near its record high. This is similar to the bearishness seen in the monthly Merrill Lynch fund manager survey. As you can see, 32% of individual investors are bears and just 31.7% are bulls.
The CNN fear and greed index shows similar results as it is at 59 which is only slightly in the greed category. However, that index is low because of the junk bond market. The yield spread between junk bonds and investment grade bonds puts this segment in the extreme fear category. The spread is pretty close to where it peaked at in December 2018.
Investors Aren’t Bullish
The stock market is truly climbing the wall of worry. 20.7% year to date gains aren’t enough to make individual investors bullish. Investors might be bearish because the economy is in a slowdown and the trade war might be a negative future catalyst if new tariffs are added. This is much different from the euphoria peak in January 2018 when investors were getting ready for the fiscal stimulus to boost economic growth. There was no volatility in 2017 as there was a global synchronized expansion. Now the global economy is mired in a slowdown and central banks around the world are easing. There isn’t widespread pessimism obviously, but having about half the percentage of bulls of January 2018 when stocks are now higher is noteworthy. It could mean there’s room to the upside even after this amazing 2019 rally.
Nice Durable Goods Orders Report
If investors need a reason to be more optimistic on the economy besides just betting on Fed rate cuts, the June durable goods orders report delivered as monthly new orders growth was 2% which beat estimates for 0.5%. On the negative side May new orders growth was revised down from -1.3% to -2.3%. Headline growth was boosted by the 75.5% increase in civilian aircraft orders as Boeing’s 737 issues in May made for a very easy comparison.
Even though this report was boosted by the volatile aircraft orders, underlying orders growth was also great on a monthly basis and showed modest improvement on a yearly basis. Ex-transportation monthly orders growth was 1.2% which beat the high end of the estimate range of 0.5% even though May’s reading was revised up from 0.3% to 0.5%. The star of this report was core orders growth as it was 1.9% which beat estimates for 0.2%. May’s growth was revised from 0.4% to 0.3%. The monthly gain in core capital goods orders was the highest since February 2008. As you can see from the chart below, it hit $70.1 billion which was the highest ever and represents 2% yearly growth. That’s above May’s 1.2% growth rate. Core capital goods shipments hit a new record and had 3.4% yearly growth.
There isn’t much evidence in this report to support the weakness seen in Markit’s July flash manufacturing PMI. For example, the auto industry hurt the manufacturing PMI, but there was 3.1% growth in motor vehicle orders in June. Those aren’t from the same month, but Markit’s manufacturing PMI was also weak in June. Other strong parts in this report were that machinery and fabrications orders were up 2.4% and 2.1% monthly. Primary metals orders were up 0.8%. The main weak points were the 32.1% decline in defense aircraft orders and the 0.7% decline in unfilled orders (3rd straight monthly decline).
Millennials Not Leaving Home
Millennials aren’t moving out of their parent’s house even though the economy has been in an expansion for over 10 years. The weak cyclical economy can’t be an excuse anymore. This is a secular trend. The chart below shows the share of 18-34 year olds living at home has stayed elevated (in the low 30% range) for the past few years.
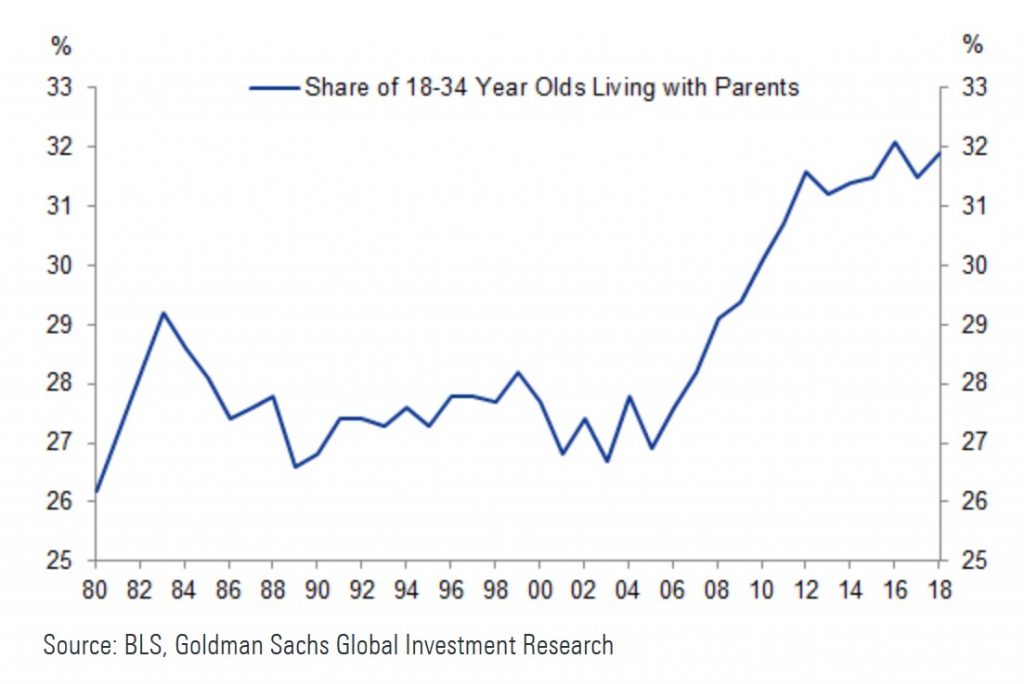
Obviously, there is a dramatic difference between 18-22 year olds living at home and 30-34 year olds living at home. The first group either just started working or is still in school, while the second group probably has been working for about 10 years. The reason for this uptick is probably a combination of expensive housing, changing social norms, student loan debt, and delayed marriages.
Modestly Weak Kansas City Fed Index
We’ve seen a mixture of data in manufacturing. The Philly Fed and Empire Fed indexes came in better than expected. The Richmond Fed and Markit manufacturing PMI weren’t good. We just reviewed a solid durable goods orders report. The Kansas City Fed manufacturing report was weak, but not terrible. As you can see from the chart below, the index fell 1 point to -1 which missed estimates for 2. The production and volume of new orders indexes fell 3 and 7 points to -6 and -2.
Unlike the Richmond Fed index, which had a monumental difference between expectations and the current index, they were similar in this report as the expectations index fell from 11 to 9. Only 1 of the 10 quotes in this report mentioned tariffs. One firm stated, “Our heavy duty truck customers have been running close to capacity for the last year driving our manufacturing volume. We are now just starting to see a 10% drop in third quarter volumes and probably will see another 10% in 2020. So volume is starting to decline but still at strong levels.”
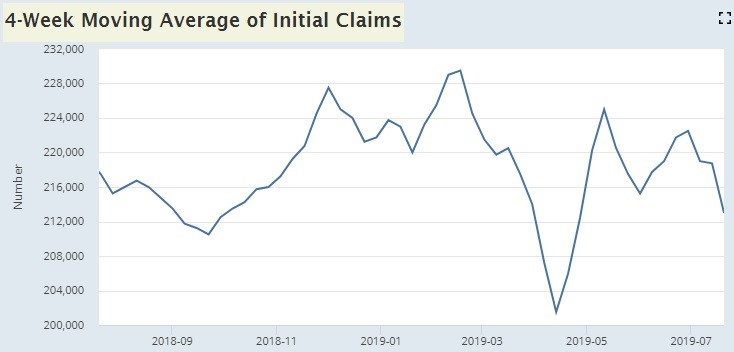
Jobless Claims Fall Again
Jobless claims continue to stay correlated with the stock market as they fell 10,000 to 206,000. As you can see from the chart below, the 4 week moving average has fallen every week in July. It’s now at just 213,000.
We don’t know where the ISM new orders index will end up at, but jobless claims will definitely help the leading economic indicators index in July.
Conclusion
Stocks have rallied all year except in May, but investors aren’t euphoric. There are actually more bears than bulls. The durable goods orders report was fantastic on a monthly basis and showed the manufacturing economy isn’t headed for a recession with its yearly growth improvement. Millennials still won’t move out of their parents’ house. The Kansas Fed manufacturing index fell 1 point. Jobless claims continue to be low, which doesn’t jive with the Fed cutting rates next week.
Have comments? Join the conversation on Twitter.
Disclaimer: The content on this site is for general informational and entertainment purposes only and should not be construed as financial advice. You agree that any decision you make will be based upon an independent investigation by a certified professional. Please read full disclaimer and privacy policy before reading any of our content.


