UPFINA's Mission: The pursuit of truth in finance and economics to form an unbiased view of current events in order to understand human action, its causes and effects. Read about us and our mission here.
Reading Time: 4 minutes
Black Friday went well for online retailers, but not for brick and mortar stores. On Black Friday, brick and mortar sales fell 6.2%. Sales were up 2.3% on Thanksgiving, making total yearly growth in the 2 days combined -3%. Sales have been down on Black Friday for 3 straight years and down both days combined for at least 4 years. As you can see from the chart below, the 12 month average of employment growth for brick and mortar stores has been mostly negative since 2017.
It’s no surprise warehouse, courier, and non-store retail employment growth has been stronger since 2014. Even this growth has slowed recently along with the rest of the labor market.
Adobe tracks 80 of the top 100 online retailers. According to Adobe Analytics, consumers spent $5.4 billion online on Black Friday which is 22.3% growth. (There were over $4 billion in online sales on Thanksgiving). Black Friday and Small Business Saturday are becoming extensions of Cyber Monday as more spending is done online. The average order online on Black Friday was $168 which is up 6% from last year and is a record high. On Small Business Saturday there were $3.6 billion in online sales which is 18% yearly growth. Total online sales from November 1st to December 1st were $72.1 billion. Total online sales this holiday season are expected to be $143.7 billion. Because Thanksgiving was late this year, Cyber Monday is in December. Cyber Monday sales were up 16.9% from last year as they hit $9.2 billion. That’s up from $7.9 billion, but slightly missed Adobe’s estimate for $9.4 billion. The snowy weather likely boosted online sales. 47.5% of online sales are expected to be through mobile devices this holiday shopping season which is up from 43% in 2018.
Weak ISM PMI
The theory behind stocks rallying when the ISM manufacturing PMI is below 50 is that the economy is cyclical and markets anticipate changes to the economy. The market has sold off (or rallied less than it would have) by the time the PMI has fallen below 50. When it’s low and starting to increase, a cyclical upturn starts being priced in. This explains why the stock market fell on Monday after the ISM PMI disappointed.
There was a window where the PMI could have increased, but still been below 50, but that was missed. It’s important to note that stocks have already had a great run, so staying below 50 might not be ideal even though historically returns are better when it is there. The gains have been had; now we need to see an upturn or some will be lost. Obviously, this is only 1 month of data, so this doesn’t mean a cyclical upswing won’t happen in 1H 2020. The Markit PMI showed more promise, but stocks ignored it even though it has a greater sample size. That’s nothing new.
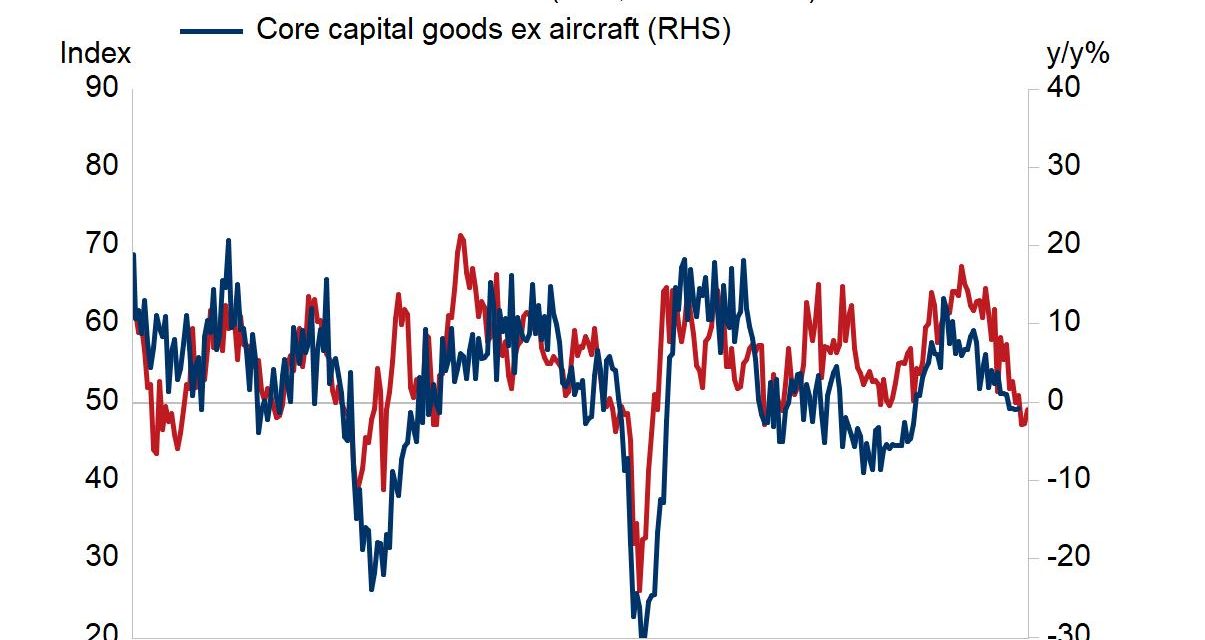
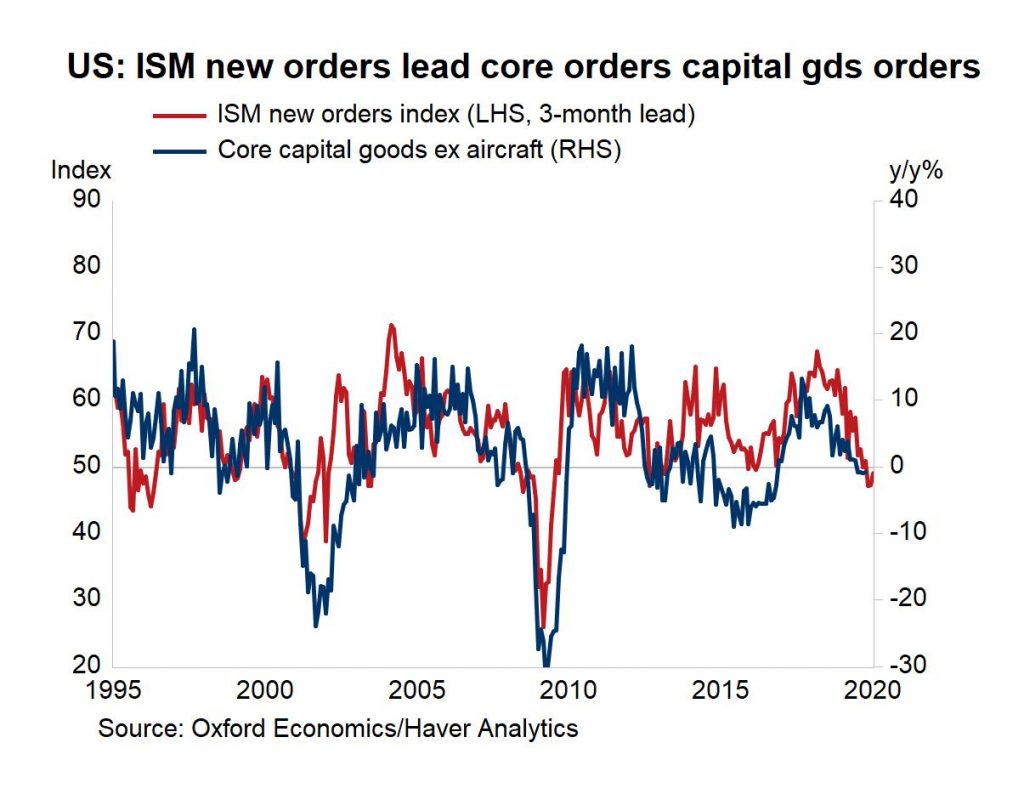
Specifically, the November ISM PMI was 48.1 which fell from 48.3 and missed the consensus of 49.4. This PMI was once again below the level suggested by the average of the 5 regional Fed manufacturing surveys. The PMI is consistent with 1.5% GDP growth. That growth rate would have been very high compared to the Atlanta Fed Nowcast a couple weeks ago, but now it’s slightly lower than the Nowcast as recent data has pulled up estimates. The new orders index fell 1.9 to 47.2. As you can see from the chart below, that’s bad news for core capital goods orders excluding aircrafts. Of the 18 manufacturing industries, 5 reported growth in new orders and 12 reported a decline in new orders.
The production index was up 2.9 points to 49.1 and the employment index was down 1.1 to 46.6. Only the supplier deliveries index was above 50 as it was up 2.5 points to 52. Unfortunately, this means deliveries were slower. In the comments section, 3 of 10 quotes mentioned tariffs. A Wood Products firm stated, “Markets have downshifted further. The continued confusion surrounding China trade has kept export markets on edge. Profits are elusive. Cash-flow planning is paramount. The general economy is slowing down.”
Markit PMI Hits 7 Month High
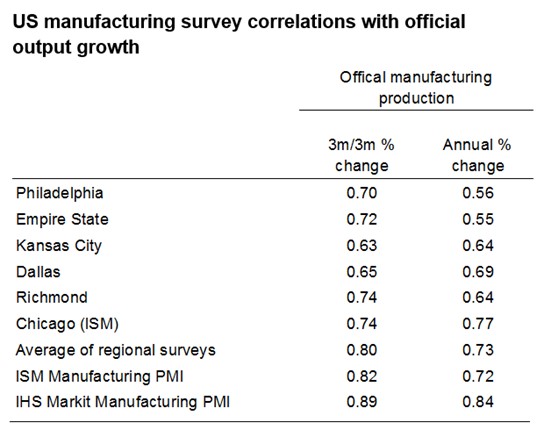
The November Markit manufacturing PMI essentially gave the market exactly what it wanted, but since it doesn’t care much about Markit’s results, it still sold off. The Markit manufacturing PMI actually never fell below 50. The Markit report includes small, medium, and large firms, while the ISM report only includes large firms. That implies U.S. centered small and medium sized firms are outperforming large international firms. Not only is the Markit report larger in scope, as you can see from the table below, it has a higher correlation with manufacturing production than the ISM PMI.
The chart below shows since 2017, the Markit PMI has been below the ISM PMI prior to the past few months.
The current divergence where the Markit PMI is above the ISM PMI, is the highest on record. Since the regional Fed indexes are also more positive than the ISM report, it’s possible the PMI should be in the low 50s. In that case, the stock market selloff on Monday was for naught, assuming this is why stocks fell. They may have fallen because they were overbought or because of worries about trade.
The Markit PMI is an example of a report going from okay to good. That’s amazing in rate of change terms. The PMI hit a 7 month high as it increased from 51.3 to 52.6. The output and new order growth indexes hit 10 month highs. This PMI was above the flash reading of 52.2 which means it was 53 in the 2nd half of the month. The comment section of the report stated, “A third consecutive monthly rise in the PMI indicates that U.S. manufacturing continues to pull out of its soft patch.”
Conclusion
This holiday shopping season has been great for online stores which are growing as a percentage of the total retail pie. If a brick and mortar store doesn’t have a great online presence, its days are numbered. The ISM manufacturing PMI was expected to show some sign of life, but instead it fell. The stock market ignored the Markit report which gave it exactly what it was looking for. The Markit report is larger in scope, includes medium and small businesses, and has a higher correlation with manufacturing production.
Have comments? Join the conversation on Twitter.
Disclaimer: The content on this site is for general informational and entertainment purposes only and should not be construed as financial advice. You agree that any decision you make will be based upon an independent investigation by a certified professional. Please read full disclaimer and privacy policy before reading any of our content.


