UPFINA's Mission: The pursuit of truth in finance and economics to form an unbiased view of current events in order to understand human action, its causes and effects. Read about us and our mission here.
Reading Time: 4 minutes
Either the bulls believe the economy will be stronger in 2020 or they think the current economy isn’t as bad as the initial indicators show. Revisions can change how we see the economy and they aren’t always negative. Negative revisions get more attention because missing a recession is a bigger deal than growth being at trend instead of below trend. Q3’s GDP report was revised higher from 1.9% to 2.1%. However, 0.22% of the revision was due to inventory investments. In the long run, inventories even out. Consumption growth was revised up 4 basis points. To be fair, 2.9% growth is strong. Consumption drove GDP growth, but didn’t drive the revision.
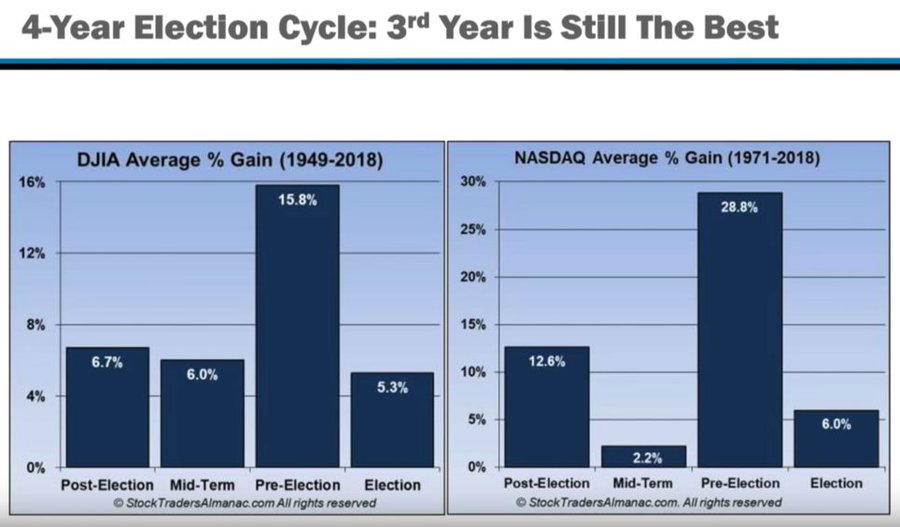
The rise in stocks is in line with the historical average when broken down by election year. In pre-election years, the Nasdaq rises 28.8% on average (1971-2018). It’s up 30.6% in 2019 as of November 29th. In election years, it rises 6%. That’s a big potential drop off in returns.
ECRI Leading Index Points Higher
Investors are always focused on the future. However, they follow economic data from the past because that’s all we have and it’s the best predictor of the future economy. That doesn’t mean the economy will always stay at the same growth rate. It means you can use the data to make predictions. One prediction is seen in the chart below.
The ECRI leading index’s yearly growth rate improved from 1.1% to 1.7% in the week of November 22nd which is the highest growth rate since June 2018. To be fair, the comp was -4.3%. Growth troughed at -6.9% in January 2019 which means growth should improve in the next few weeks. The index actually fell 0.1 to 146.8 this week, but an easier comp caused growth to increase.
This index is now facing criticism from the bears because it’s showing potential growth improvements in 2020; it’s definitely not forecasting a recession. The criticism is 3 of its 7 components are market variables (bonds, S&P 500, and commodities). That doesn’t make it a bad forecaster of the economy though. It’s weakness in late 2018 and early 2019 predicted the current weakness in 2H 2019. Markets are leading indicators for the economy. They can obviously be wrong, but this index isn’t problematic because of that.
Home Price Growth Could Be Bottoming
The MBA purchase applications index has shown demand for housing is strong as rates have been low in the past 4 months. The seasonally adjusted index in the week of November 22nd fell 1% from the previous week after rising 7%. On an unadjusted basis, yearly growth in purchase applications was 55%. That yearly growth rate is ridiculous because the previous year had Thanksgiving a week earlier.
It appears home price growth is bottoming, although, that might not be the case if the labor market weakens or rates spike. As you can see from the chart below, in September the 20 city price index’s growth rate increased from 2% to 2.1% which beat estimates for 2%. Similarly, the national index’s growth rate increased from 3.1% to 3.2%. The comps are quickly getting easier as growth went from 5.7% to 5.4% last year. It fell to 5% in November and 4.1% in January.
Phoenix had the highest growth rate yet again even though its growth fell from 6.3% to 6%. Las Vegas has seen its growth rate crash in the past 13 months as it peaked at 13.8% last August and now it’s at 2.9%. Its growth rate fell 0.4% even though its comp was 0.4% easier. The worst growth was San Francisco which saw a 0.7% decline. It had a high comp of 9.9%. Similar to the Case Shiller report, the FHFA home price index showed home price growth increase as it went from 4.6% to 5.1%. Improving home price growth will motivate builders to construct more homes. Higher construction spending means higher real residential investment growth. It will be positive again in Q4.
Solid Pending Home Sales Index Despite Drop
The October pending home sales index fell from 108.7 to 106.7 which is a 1.7% decline. There could be slight weakness coming for new and existing home sales. On the bright side, it’s at the high end of this cycle’s range. Yearly growth was 4.4% as the housing market weakened in Q4 2018. The South had 5.1% growth as its index was the highest at 125.3. The West had the highest growth as it was 7.5%, but its index was the lowest as it was 91.9. The hottest and the coolest cities are in the West.
Consumer Confidence Falls
In the week of November 23rd, jobless claims fell from 228,000 to 213,000. So much for claims signaling the labor market was starting the weaken. The 4 week moving average only fell 1,000 to 220,000 because of the elevated readings in the prior 2 weeks.
The November preliminary Conference Board consumer confidence index was a bit more disappointing than the University of Michigan index because it didn’t rebound from its 10 point decline last month as you can see from the chart below. Its latest reading showed a slight decline from 126.1 to 125.5. This was the 4th straight decline which is the longest string of losses since June 2012.
Just like the University of Michigan report, present conditions fell and expectations rose. The Present Situation Index fell from 173.5 to 166.9 and the expectations index rose from 94.5 to 97.9. The consumer’s current opinion on the labor market worsened, but expectations rose. Those saying jobs are plentiful fell from 47.7% to 44.8% and those saying jobs are hard to get rose from 11.6% to 12.7%. That’s a net decline of 4%. Those expecting there to be more jobs available fell from 16.9% to 15.7%. However, those expecting fewer jobs fell from 18% to 13.2%. That’s a net improvement of 3.6%.
Conclusion
2019 has been a great year for stocks which lines up perfectly with how stocks do in pre-election years. The ECRI leading index has the highest yearly growth in about 17 months. The housing market is improving and price growth is bottoming, much to the chagrin of buyers who think prices aren’t affordable. Consumers weren’t as relatively optimistic in the Conference Board survey (compared to this summer) as they were in the University of Michigan report. Neither include data from the 2nd half of November which is when the holiday shopping season started.
Have comments? Join the conversation on Twitter.
Disclaimer: The content on this site is for general informational and entertainment purposes only and should not be construed as financial advice. You agree that any decision you make will be based upon an independent investigation by a certified professional. Please read full disclaimer and privacy policy before reading any of our content.


