UPFINA's Mission: The pursuit of truth in finance and economics to form an unbiased view of current events in order to understand human action, its causes and effects. Read about us and our mission here.
Reading Time: 4 minutes
The S&P 500 hit a new record closing high on Tuesday April 23rd. It took 95 days for the market to fall 19.8% and 120 days for it to rise 24.7% which was the rally necessary to recover the bear market losses. The CNN fear and greed index is at 75 out of 100 which signals extreme greed. Only 13 S&P 500 stocks hit a record high on Tuesday. The S&P 500 has gone 21 straight sessions without a loss higher than 0.55%. 50 of the 77 trading days in 2019 have been positive.
The biggest reason stocks are rallying is because the decline last year was a mistake, an overreaction to the economic slowdown. Stocks crashed last year because of recession fears. The huge decline in S&P 500 earnings estimates in the first two months of 2019 reflected those fears. However, the doom and gloom presented by firms that caused analysts to lower their estimates was overzealous.
The economy isn’t even out of the slowdown yet, but traders don’t care because they are happy about the lack of a recession. The positive trade headlines with China and the Fed’s dovish turn certainly mattered to stocks, but the biggest reason stocks are up 17.03% in 2019 is because they never should have fallen so far last year. Traders missing this point are looking at the 2019 market in a vacuum, ignoring the negative 2018 performance which occurred in a year with superb earnings growth.
As you can see from the chart below, when the economy isn’t in a recession, bear markets are repudiated on average after 6.5 months. Corrections are tests to see if the economy is headed for a recession. When those tests go too far and the market nears a 20% decline, it makes sense that rapid recoveries soon follow.
An Explanation Of The Value Conundrum
Value stocks have underperformed growth stocks this cycle. Some traders take this to mean the economic cycle is almost over. Some are simply buying value stocks and going underweight or shorting growth stocks. Similar to how investing in Europe is a de facto trade to go underweight the tech sector, going long value stocks is a de facto bet against tech and healthcare stocks.
As you can see from the chart below, the correlation between the ratio of value stocks versus growth stocks and the ratio of financials & energy stocks versus technology & healthcare stocks is high.
Value indexes rely on valuation metrics like P/E and P/B to pick their members. Accounting rules generate book assets for the financial and energy sectors which give them low valuations. Tech and healthcare have less traditional assets and spend more on R&D.
This explains why value stocks have done so poorly versus growth stocks. It’s not inherently a bad thing to go long banks and energy while going underweight the tech and healthcare sectors. You just should know what you are buying when you go long value stocks. Maybe the banks and energy stocks are underperforming tech and healthcare for a reason other than that speculation has gotten out of control.
Weak Markit Flash PMI
As we mentioned earlier in this article, the economic slowdown isn’t over yet according to many reports. As you can see from the chart below, the Flash Markit PMI composite reading fell from 54.6 to 52.8 in April. That’s the lowest reading in 31 months.
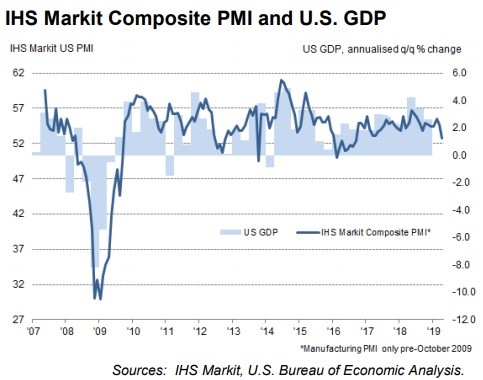
Unlike last month’s report, this time the composite was pushed down by the service sector as the service PMI fell from 55.3 to 52.9 which is a 25 month low. Manufacturing was the least problematic on a sequential basis as the PMI was unchanged at 52.4.
Overall new order growth fell which weakened hiring to the lowest growth rate since April 2017. Business optimism fell to its lowest level since June 2016. This survey is consistent with GDP growth rising just below an annualized rate of 2%. Furthermore, the Markit prediction is for 130,000 jobs created in April which is significantly below the Q1 average of 198,000 monthly job gains. Finally, average consumer price growth is expected to fall below 1% in the next few months because of weak demand trends.
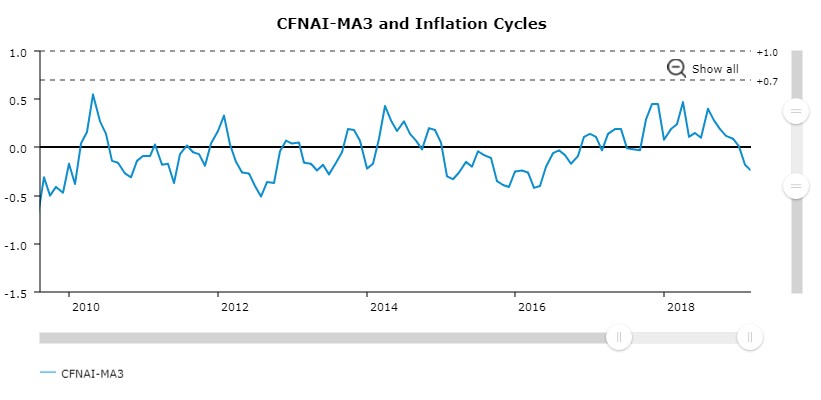
Weak Chicago Fed Reading
The Chicago Fed National Activity Index increased from -0.31 in February to -0.15 in March. However, as you can see from the chart below, the 3 month average fell from -0.18 to -0.24. That’s the weakest 3 month average since May 2016.
Anything negative means growth is below the long term trend. The index has been negative for 3 months. A reading below -0.7 signals a potential recession. In the March reading, the employment category brought down the index by 3 basis points. The personal consumption and housing category brought it down by 7 basis points. The production and income group brought it down by 10 basis points. Finally, sales, orders, and inventories had a 5 basis point positive effect on the index.
Earnings Look Great
In the first 2 months of the year, traders who bought stocks were betting that estimates were crashing way too quickly. They were correct as 81% of the first 132 firms to report earnings have beaten estimates on 6.36% growth. 59% of firms have beaten sales estimates on 4.95% growth.
The once feared earnings recession isn’t occurring. These solid EPS and sales growth rates are occurring with the economy growing below its trend (assuming the Chicago Fed index is accurate). These results are even more impressive because the comparisons are tough. This has been a great earnings season all things considered.
Conclusion
Stocks have rallied quickly since the Christmas Eve bottom, but this recovery is far from unprecedented. It’s only 2.5 months quicker than the average recovery after non-recessionary bear markets. It might not make sense to go long value stocks unless you love energy and the banks. The economy is still probably in a slowdown if you believe the March Chicago Fed national activity index and the April Flash Markit PMI. This has been a great earnings season when you consider the terrible expectations, the tough comparisons, and the economic slowdown.
Have comments? Join the conversation on Twitter.
Disclaimer: The content on this site is for general informational and entertainment purposes only and should not be construed as financial advice. You agree that any decision you make will be based upon an independent investigation by a certified professional. Please read full disclaimer and privacy policy before reading any of our content.


