UPFINA's Mission: The pursuit of truth in finance and economics to form an unbiased view of current events in order to understand human action, its causes and effects. Read about us and our mission here.
Reading Time: 5 minutes
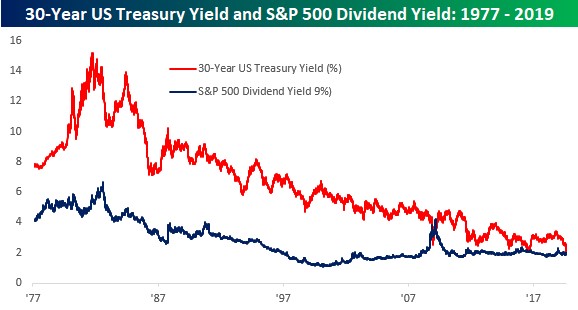
The 30 year yield has been crashing; it has made several new record lows this August. At 1.93%, it is below the S&P 500’s dividend yield for the first time since March 2009 as you can see from the chart below.
It’s not just the traditional dividend stocks that have higher yields than the long bond. For example, Intel’s 2.75% dividend yield is much higher than the entire treasury curve.
Speaking of the curve, the 30 year yield fell below the 3 month bill. That might be because the Fed doesn’t see the need to cut rates aggressively as the economy isn’t close to a recession based on the latest economic data. Aside from fiscal stimulus, the best antidote to economic weakness is ending the trade war. To be clear, we are saying current growth isn’t recessionary, not that the economy isn’t going to fall into a recession in the next couple quarters.
If the Fed cut rates to zero and then there is a trade deal this fall, the Fed would likely need to raise rates again. There’s a case to be made to not overreact to the planed tariffs and the huge rally in the long bond. This example of the 30 year yield being below the S&P 500’s dividend yield isn’t like in 2008 and 2009 because stocks haven’t cratered. If stocks did fall, we’d see the S&P 500’s yield even higher than the long bond. This curious example of stocks not falling with yields partially explains why the CNN fear and greed index is at 16, which is extreme fear, even though the S&P 500 is only 5.2% off its record high. Junk bond demand and the difference between stock and bond performance are in extreme fear.
The Case For Utilities
It’s no surprise that utilities have done absurdly well in 2019 because growth is slowing and the 30 year yield is at a record low. The XLU ETF was up 19.8% year to date as of August 27th. The S&P 500 was up 14.45%. It doesn’t make sense for utilities to outperform stocks in a great year because usually stocks don’t rally as growth slows. You’d expect growth stocks to drive the market if it has a better than average year.
The 3 charts below show the case for the utilities.
When global financial conditions tighten, the utilities sector outperforms the S&P 500. When the ISM manufacturing index falls, utilities outperform the S&P 500. Finally, when the 10 year bond yield falls, utilities outperform the S&P 500.
Another Oddity: Wage Growth Is Higher Than The 10 Year Yield
The chart below shows the 10 year yield not the 30 year yield, but both have rallied similarly recently.
Since 1972 there has only been one other month when production and non-supervisory wages rose quicker than the 10 year yield. December 2008 wage growth doesn’t mean nearly as much as the current wage growth because the unemployment rate was much higher then. Now the labor market is strong as real wage growth is positive and the unemployment rate is low. You’d expect long bonds to rally when the economy is weak. You don’t see a great labor market in weak economies. This situation is perfectly in tune with the Q2 GDP report. Business investment growth hurt Q2 GDP, but consumption growth was very strong. In the first revision to Q2 GDP, consumption growth was shown to be 4.7%.
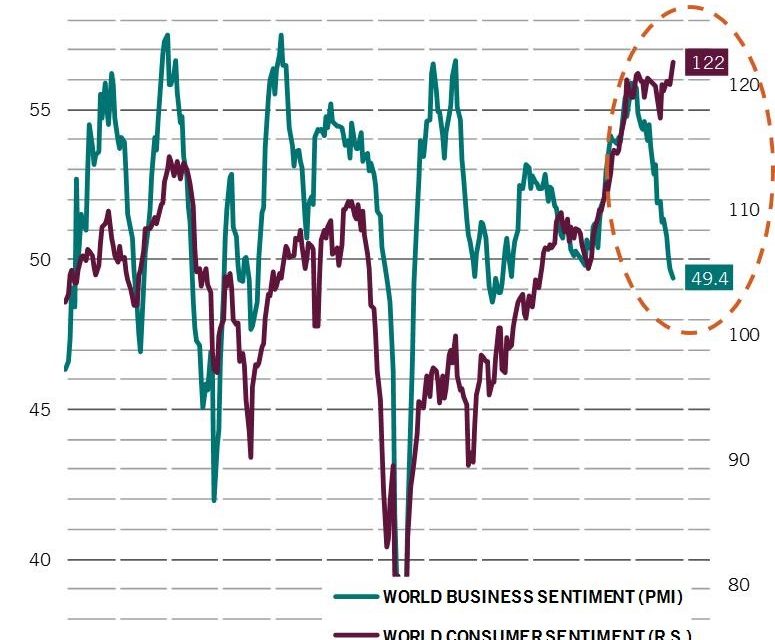
Businesses Are Pessimistic & Consumers Are Optimistic
The consumer is preventing the global economy from falling into a recession. The trade war is hurting business sentiment, but hasn’t yet hurt consumer sentiment. The chart below shows the unique divergence between consumer and business sentiment.
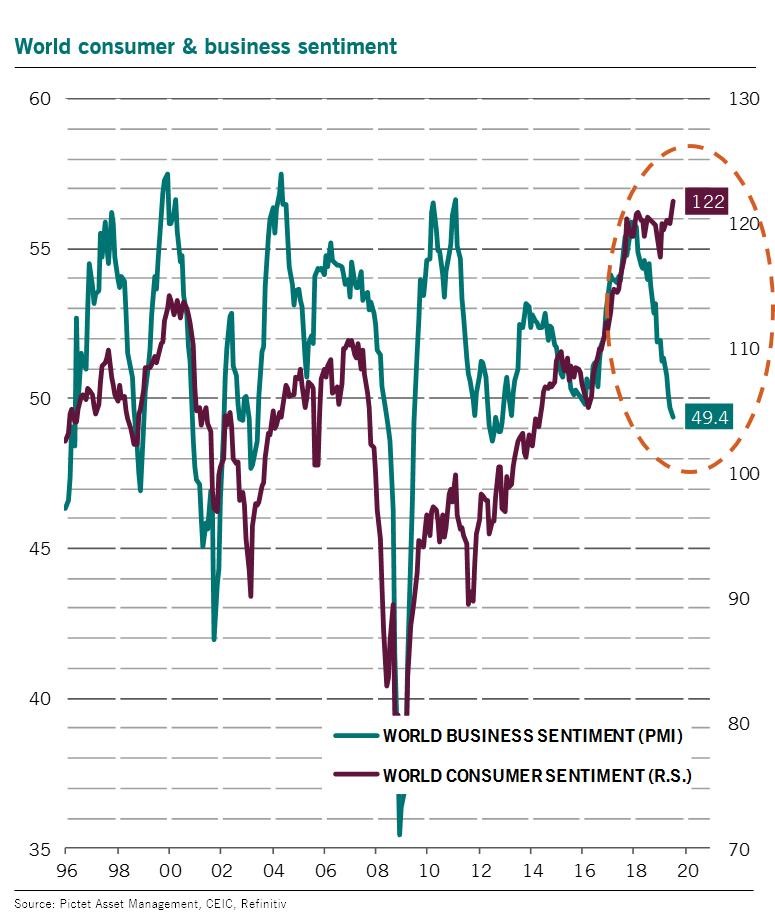
Global business sentiment has cratered, while global consumer sentiment is at a record high. The developed market industrial sector is contracting (down 0.4%) and emerging market industrial production growth has fallen to 2.1%.
Great Conference Board Sentiment Reading
The August Conference Board consumer confidence index was very strong, unlike the preliminary University of Michigan report. As you can see from the chart below, that divergence is actually an indicator.
The later in the expansion, the more the Conference Board index rises above the University of Michigan survey. The divergence just hit a record high.
Specifically, the Conference Board index fell from 135.8 to 135.1 which beat estimates for 130 and the high end of the estimate range which was 133. The divergence between the Present and Expectations index increased like usually happens the longer the cycle goes. The Present index was up from 170.9 to 177.2. The Expectations index fell from 112.4 to 107. That’s the largest differential since November 2000.
Consumers were confident about the current labor market, but not as optimistic about the future labor market. Those saying “jobs are plentiful” increased from 45.6% to 51.2% and those saying “jobs are hard to get” fell from 12.5% to 11.8%. Expectations weren’t as great as the proportion of consumers expecting more jobs to be available in the next 6 months fell slightly from 19.9% to 19.7%. Those expecting fewer jobs rose from 11.1% to 13.6%.
Tariffs Could Hurt The Consumer
The Redbook same store sale growth reading in the week of August 24th showed growth spiked from 4.9% to 5.7%, signaling there isn’t any worry about the tariffs yet. The chart below shows how big of an impact the next rounds of tariffs will have on the consumer.
In September, 40% more final consumer goods from China will be taxed, bringing the total to 69%. Another 30% of goods will be taxed starting on December 15th. Many goods on holiday shopping lists will start being taxed on the 15th to prevent a negative impact on holiday retail sales.
Conclusion
The consumer is the economy’s last hope to avoid a recession. The situation isn’t dire though as jobless claims are low and real wage growth is positive. The tariffs can have a big impact on the economy because they are about to strike the consumer which is the driver of the economy. The game of chicken that is the trade war has reached a fever pitch. As of December 15th, 96.8% of Chinese imports will be taxed. Trump has gone nearly as far as he can go with tariffs.
Have comments? Join the conversation on Twitter.
Disclaimer: The content on this site is for general informational and entertainment purposes only and should not be construed as financial advice. You agree that any decision you make will be based upon an independent investigation by a certified professional. Please read full disclaimer and privacy policy before reading any of our content.


