UPFINA's Mission: The pursuit of truth in finance and economics to form an unbiased view of current events in order to understand human action, its causes and effects. Read about us and our mission here.
Reading Time: 5 minutes
The current bull market is one of the biggest and longest in history. Although the rally started with a broad base of support, the latest movement in the rally has been concentrated in the top 5 tech stocks. At the end of bull markets, indexes are pushed higher by leaders, or what is commonly referred to as a melt up in value. Belief in these leaders starts because of strong business fundamentals and morphs into being faith based as momentum traders start to ride the wave. In the 1960s and 1970s, the leaders of the bull market were called the nifty fifty. These were high valuation, high growth stocks which investors bought and held. In the 1990s, technology stocks led the Nasdaq to an all-time high as speculation was abound. Investors in that period speculated on stocks which didn’t have revenues; instead they used eyeballs to measure stock prices. In 2007, the leading stocks were oil firms and fertilizer firms. Oil went to $147 per barrel and the price of potash went to above $850 per metric ton (now it’s near $200).
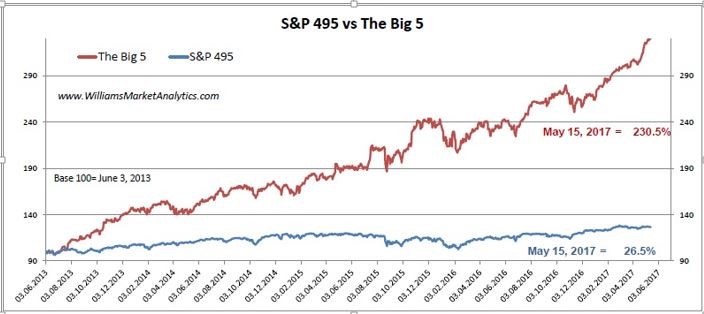
This rally has lately been mainly driven by the stock price increases of the big 5 tech stocks which are Apple, Alphabet, Amazon, Microsoft, and Facebook. The reason these 5 tech stocks can move the market so much higher is because most indexes besides the Dow are market cap weighted. Apple’s market cap is about $800 billion, Alphabet’s is near $650 billion, Microsoft’s is near $550 billion, Amazon’s is about $475 billion, and Facebook’s is near $500 billion. The big 5 tech stocks are up 230.5% from June 3rd, 2013 to May 15th, 2017. In the same period, the S&P 500, excluding those firms, has only gone up 26.5%. Without those top 5 stocks, the bull market wouldn’t be that strong. Investors have a herd mentality and want to chase high returns.
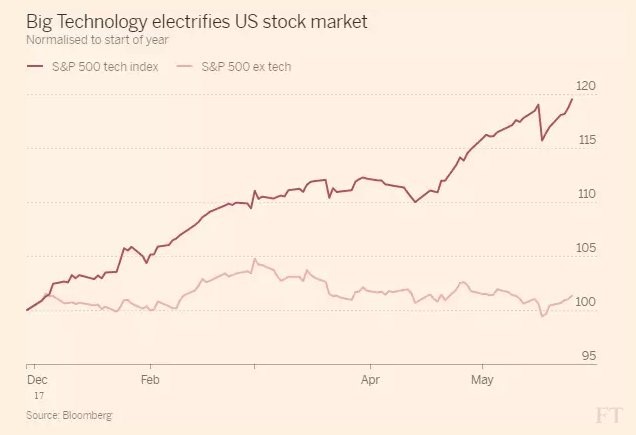
The rally in stock market since December has been almost exclusively due to technology as you can see in the chart below. The initial pop in the stock market after the Trump election was led by financials as they got a boost due to excitement about regulation cuts and rate hikes. It would be inaccurate to call the rally since then part of the Trump rally because the big tech firms have led the market since 2013.
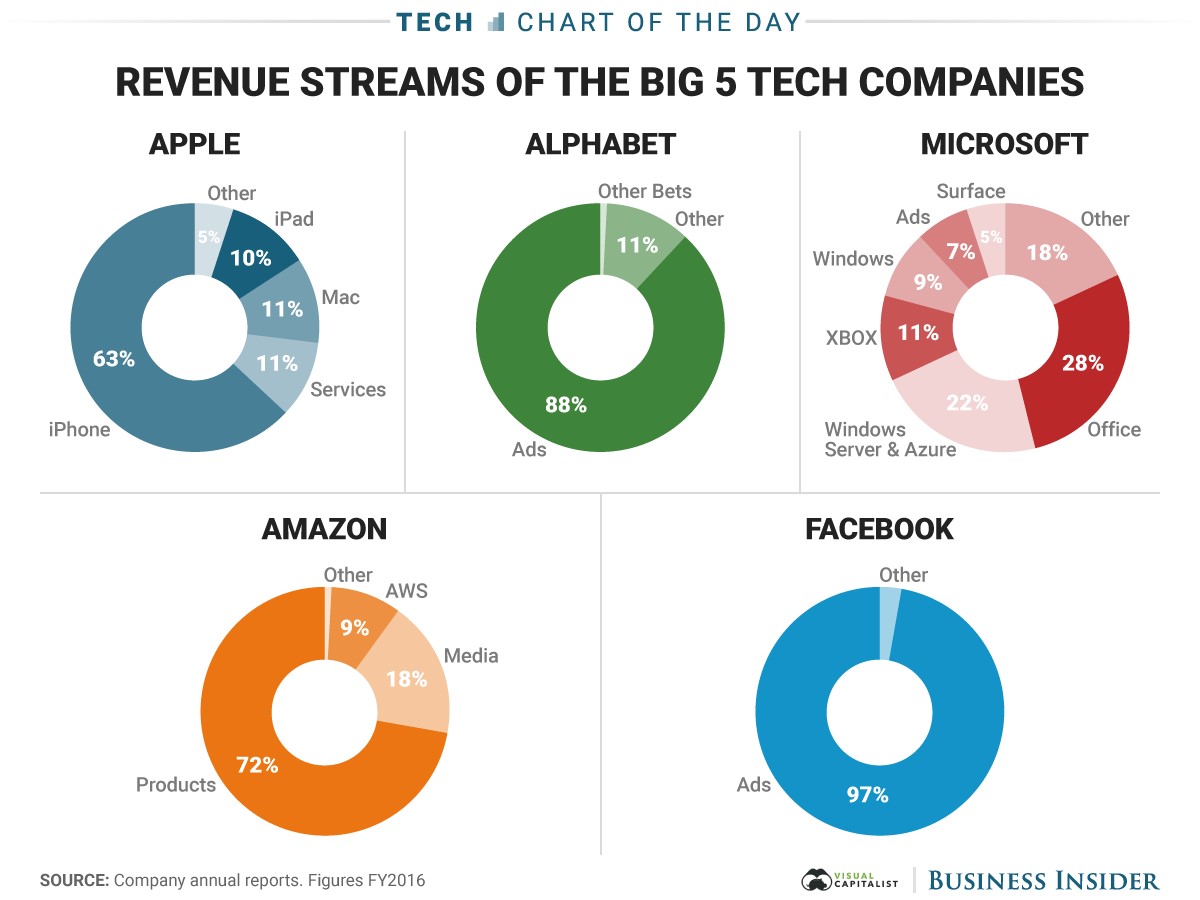
Now let’s look at the business models of the big 5 tech stocks. The chart below breaks down the revenue streams of each large cap tech stock.
The one caveat with this graphic is that Amazon’s web services business accounts for over 3/4ths of its profits even though it only made up 9% of revenues in 2016. Only Microsoft is highly diversified. Apple relies on iPhones, Alphabet relies on ads, Facebook relies on ads, and Amazon relies on the cloud. Azure is Microsoft’s cloud platform, which is not as successful as Amazon’s cloud platform.
While Apple’s services business is growing steadily, Apple is currently seeing declining margins because it hasn’t found a replacement device for the iPhone cash cow. Being a hardware firm is a difficult business to maintain margins in because prices of consumer tech always have come down in the past with continued innovation. The reason why these firms have had such high margins is because they dominate their respective industries. Because of the changing landscape of internet usage, Facebook will have to chase the new trends when new platforms grow in popularity. Facebook may be able to fend off the competition from Snapchat, but there will be innovation which transforms the internet further in the future which Facebook may not be able to copy.
The point in criticizing these tech names isn’t to deny their success in any way. The point is that technology is the most competitive disruptive industry in the world; a monopoly today can easily be gone in a decade. In the mid-1990s the leaders were called the four horsemen of tech. They were Cisco Systems, Dell, Microsoft, and Intel. The four horsemen of the internet were Cisco Systems, Sun Microsystems, EMC, and Oracle. The Nasdaq fell 86% after the tech bubble burst. The current acronym which describes the top tech stocks is FANG which is Facebook, Amazon, Netflix, and Google. A larger and less used acronym is TFAANG which includes Tesla and Apple.
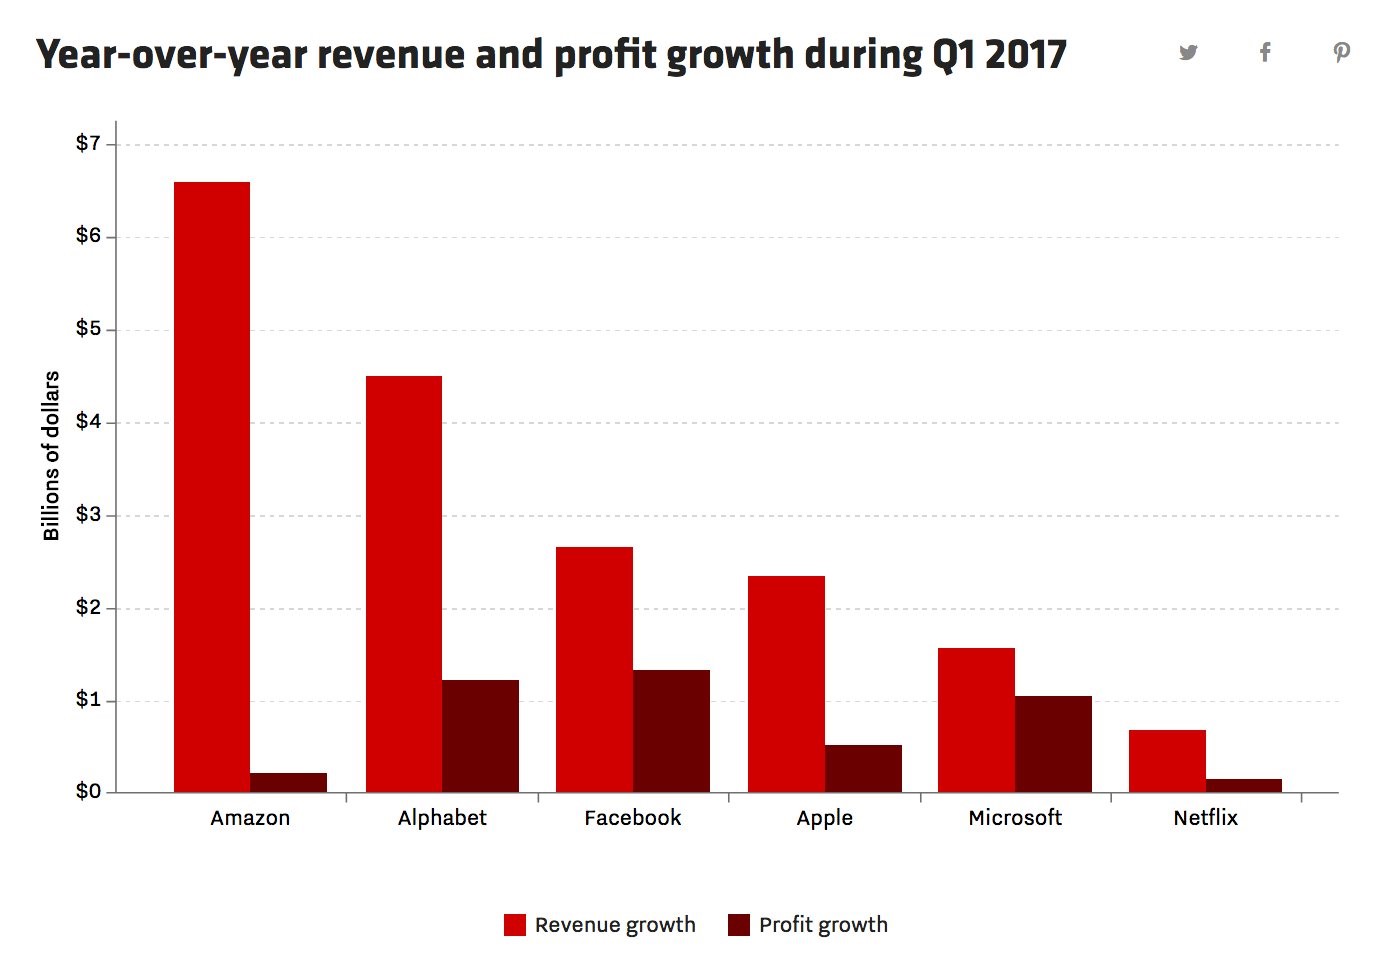
The chart below shows the recent success the members of FANG have had. Amazon’s revenue growth has come from taking share from physical retailers, but the margins are slim, so that hasn’t translated into profit growth. Netflix has negative free cash flow, but speculators are betting on its international growth strategy. Tesla cannot be in this chart because it loses money on every car it sells. Speculators believe that it will be able to grow sales and profits with its Model 3 which is a cheaper electric car which goes on sale in late 2017/early 2018.
With such large spikes in their stock prices, these stocks have gotten expensive even with their increase in profitability and sales. The first chart below shows the price to earnings ratio for these tech names. All of them except Apple have a higher current PE and forward PE than the S&P 500. Apple has the lowest PE because the iPhone’s growth has stalled. Netflix is investing its domestic profits into the international business which is why its profits are low and its PE is high. The second chart shows PEG which is the ratio of PE to growth. All of these firms have a higher PEG than the S&P 500. Amazon relies on profitability from the cloud division. It’s main product sales division has low margins which explains its exorbitant PEG. The final chart shows the price to sales ratios. As you can see, Facebook’s P/S is very high because of its high margins. All of the top tech stocks have higher price to sales ratios than the S&P 500 as they either have high margins or high growth.
Conclusion
Technology drove the stock market rally from 2013 to 2017. While tech stocks have rallied, their profits have mostly increased as well. The question for investors to determine is if their high margins will be sustained and whether their monopolies will be maintained?
Have comments? Join the conversation on Twitter.
Disclaimer: The content on this site is for general informational and entertainment purposes only and should not be construed as financial advice. You agree that any decision you make will be based upon an independent investigation by a certified professional. Please read full disclaimer and privacy policy before reading any of our content.


