UPFINA's Mission: The pursuit of truth in finance and economics to form an unbiased view of current events in order to understand human action, its causes and effects. Read about us and our mission here.
Reading Time: 4 minutes
The June jobs report showed there were 224,000 jobs created which beat estimates for 165,000. The high end of the estimate range was 205,000. Yes, the previous 2 reports were revised down by a combined 11,000 and the government created a lot more jobs than expected, but this was still a good report. Before we get into the details of this report, let’s look at how it affected markets because that was the most interesting aspect of it.
This report caused stocks to fall modestly as the S&P 500 fell 0.18% on Friday. Keep in mind stocks were a bit overvalued as the percentage of bulls was higher than the percentage of bears in the latest AAII sentiment survey. That ended the 7 week streak of bears being more prevalent than bulls which was the longest streak since February 2016. Stocks may have fallen because this very solid jobs report made rate cuts less likely. The chance of a 50 basis point cut on July 31st is now 7%; it was 32.3% on June 28th. The odds of at least 3 rate cuts in 2019 have fallen from 59% on June 28th to just 46%.
Reflecting the lower odds of multiple rate cuts, on Friday the 2 year yield fell 10 basis points to 1.86%. The 10 year yield probably fell less (8 basis points) because the effect this jobs report had on future Fed policy is larger than its effect on investors’ opinion on the economy. To the Fed, this is a key report that measures whether it is achieving one of its mandates (maximum employment). To investors, this is just one data point, albeit an import one. Other parts of the economy are weakening even if the labor market is solid. These factors could close the 17 basis point gap between the 2 bond yields.
As you can see from the chart above, the market usually underprices the odds of rate cuts. It would be a first if the market overpriced the chances of cuts. It’s weird because the odds of cuts make it look like the market is almost expecting a recession, yet stocks are near their all-time highs.
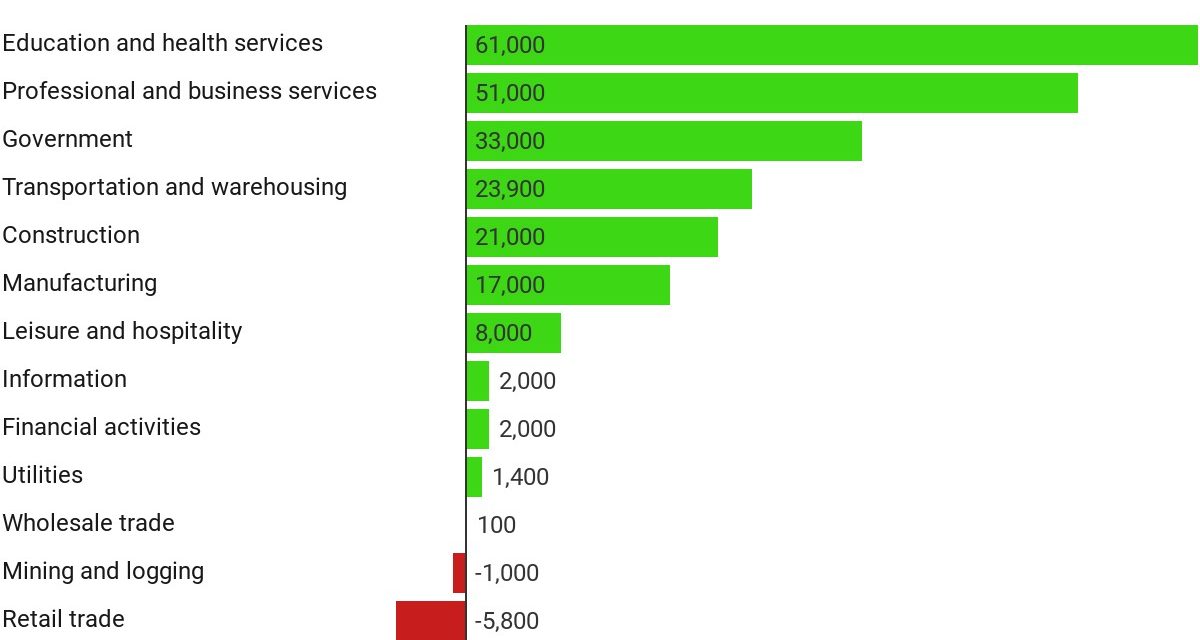
Where The Jobs Were
As we mentioned, the government added a lot more jobs than expected. The chart below shows the government added 33,000 jobs. It was expected to add 16,000 jobs. This wasn’t because of the census as most of these jobs were created by local governments.
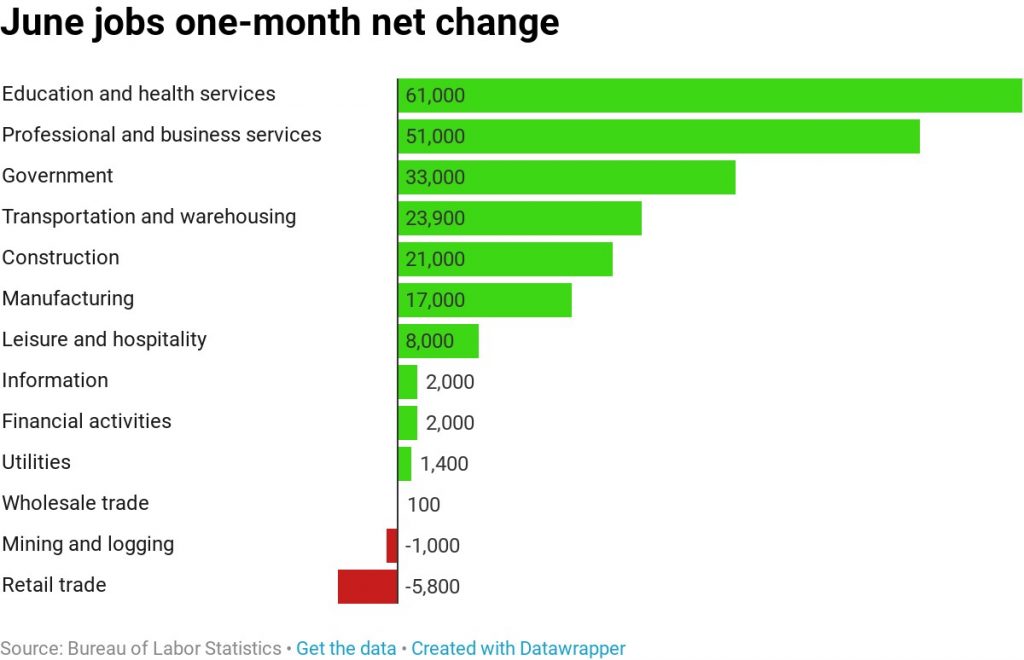
Local governments added 29,000 jobs (26,000 non-education jobs). The Federal government only added 1,000 jobs ex postal service. We will look out for job creation caused by the census in the next 12 months. The government has less options to hire workers than usual as the labor market is relatively tight, although there is still slack left. Because the government added more jobs than expected, private sector payrolls beat by slightly less than the headline. There were 191,000 private sector jobs created instead of 149,000.
The ADP report showed the manufacturing sector added 7,000 jobs, but the BLS report showed it added 17,000 jobs. That beat estimates for 2,000 and calls into question some of the weak manufacturing data we’ve seen lately (although the ISM manufacturing employment index did increase 0.8 to 54.5). Construction added 21,000 jobs which is way different from the ADP report which said it added -18,000 jobs. Education and healthcare added 61,000 jobs in the BLS report and 55,000 in the ADP report. This powerhouse isn’t highly cyclical. This industry group’s expansion explains why this has been the longest run of job creation ever by far.
Wage Growth & Labor Force Participation Rate
Average hourly earnings growth was 0.2% monthly which missed estimates for 0.3%. At least the May reading was revised up a tick to 0.3%. As the chart below shows, yearly growth was 3.1% which missed estimates for 3.2% and was below May’s growth rate which was also revised up a tick.
The average work week stayed at 34.4 hours which missed estimates for 34.5 hours. Weekly wage growth fell ever so slightly from 2.85% to 2.84%. Investors must realize that this decline is mitigated by the decline in inflation. In May, CPI fell from 2% to 1.8%. It wouldn’t be surprising if we saw another weak CPI reading in June. CPI peaked at 2.95% in July 2018.
The unemployment rate rose from 3.6% to 3.7%, but the overall labor force participation rate also rose from 62.8% to 62.9%. It’s good to see participation rising even if the unemployment rate rises. The prime age labor force participation rate increased from 82.1% to 82.2%. That’s the first monthly increase since January. The underemployment rate rose 0.1% to 7.2%, but it’s still below the previous cycle’s trough of 7.9%.
The Bearish Case
We’re always interested in both the bearish and bullish case for the economy, stocks, and bonds as long as it’s backed by facts. The bears state the ADP report better measures job growth at small businesses than the BLS report. That’s important because, as you can see from the chart below, the yearly growth in small business job creation has diverged from that of larger businesses.
2 months in a row, small businesses have created negative jobs. Let’s watch the next few reports to see if this becomes a trend.
Higher Quits Rate Incoming
The chart below shows the historical correlation between job leavers and the quits rate implies the 14.7% job leavers rate means the quits rate will hit a record high.
A high quits rate means the labor market is strong. When people quit their jobs in search for better paying jobs, their wage growth increases. If more people quit, there should be higher wage growth. We will see the quits rate in the May JOLTS report on July 9th. It will take another month to see the quits rate from June.
Conclusion
The solid June jobs report makes a 50 basis point cut in July very unlikely. This report pushed treasury yields higher, especially on the near end. Stocks should be able to handle an improved economy with less rate cuts since inflation is below trend. Declining inflation is helping real wage growth at a time when nominal growth is falling. One thing to worry about is small business job creation. In the next year, we will look out for census driven job creation. It shouldn’t be a surprise there hasn’t been much census hiring yet. It usually occurs closer to the census. Based on the percentage of job leavers, the quits rate should hit a record high in June. We need to wait a month to see the June JOLTS report though.
Have comments? Join the conversation on Twitter.
Disclaimer: The content on this site is for general informational and entertainment purposes only and should not be construed as financial advice. You agree that any decision you make will be based upon an independent investigation by a certified professional. Please read full disclaimer and privacy policy before reading any of our content.


