UPFINA's Mission: The pursuit of truth in finance and economics to form an unbiased view of current events in order to understand human action, its causes and effects. Read about us and our mission here.
Reading Time: 5 minutes
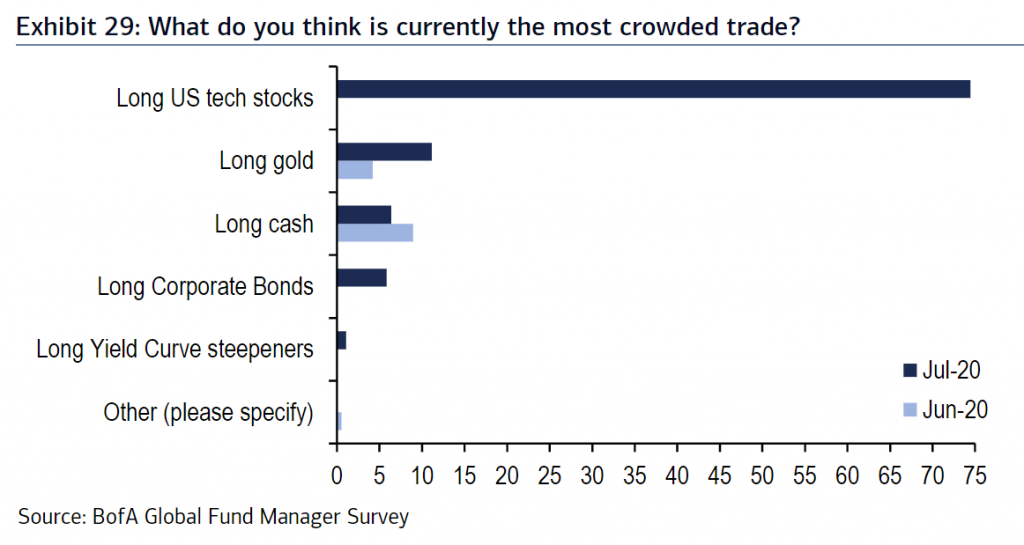
Usually, there isn’t unanimity in the Bank of America fund manager poll which asks which is the most crowded trade, but there was in July because of how well tech stocks have done. As you can see from the chart below, 74% of fund managers said long U.S. tech stocks was the most crowded trade. That’s the highest reading ever for any trade. Gold hit $1,800 which put it close to a new record high, but that didn’t stand a chance compared to the tech sector. That’s because the big internet names are huge. Apple, Microsoft, Amazon, Facebook, and Alphabet combined are 20.4% of the Wilshire 5,000 which includes all the publicly traded U.S. stocks. Apple, Amazon, and Microsoft each have market caps between $1.6 and $1.7 trillion. The entire Russell 2000 only has a market cap of $2.03 trillion.
FANG Index Explodes
The tech and FANG stocks have exploded for a few reasons. First, the market has momentum following the March bottom. FANG has led markets for 6 years. They regained their place as leaders in the past few weeks. FANG+ is up 82.5% since the bottom. 2/3rds of the S&P 500’s rally in the past 5 years has come from the FAAMNG stocks. It has been incredibly tough for funds to outperform without owning these large cap stocks.
We aren’t advising you to avoid them, but recognize that you have a huge advantage by not having to own them. Smaller companies can drive your account because you aren’t investing a multibillion-dollar portfolio. You also don’t have investors who would think you are bad at your job because you don’t own Amazon. That’s called career risk. You can buy whatever stocks you want and it doesn’t matter if you underperform for a few quarters. You should be focused on growing your wealth for the long-term, not over a few months.
These stocks have gotten help from retail traders who are piling into the winners. Tesla is the most prominent example. It’s not part of the FAANG index, but it is considered to be a tech stock by the bulls. According to Robintrack 37,600 retail traders piled into Tesla stock in 4 hours on Monday. Investors like the cloud and online retail stocks because they do well during the shutdown; they are seen as safety stocks even though they have high valuations. The final aspect contributing to this rally is low inflation and low interest rates. These aren’t new phenomena, but the rally in growth stocks also isn’t new, so it works.
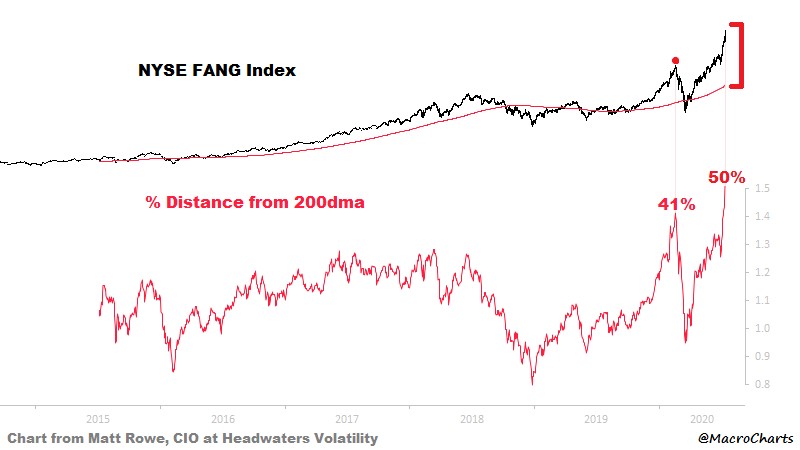
This rally all adds up to the FANG index getting 50% above its 200 day moving average as you can see from the chart above. That’s the highest distance ever, but we only have 5 years of data. If you look at the Nasdaq which has more history, the highest distance ever was 55% above the 200 day moving average at the peak of the tech bubble. In other words, this FANG dislocation is near the dislocation at the peak of the tech bubble.
According to the 3 month average of Sentiment Trader’s Nasdaq 100 Optimism index, confidence is only a couple points below the 2000 peak. This index is based on price action, the difference from the net asset value of the Nasdaq 100 ETF, the put to call ratio, and future volatility expectations. The VIX is unusually high for such a rally. The only other time the VIX closed above 27 with the S&P 500 within 5% of its record was April 2000.
Is It Time For Equal Weight?
The weighting of the top 5 stocks in the S&P 500 is at a multidecade high, but this percentage wasn’t unusual in the first half of the 20th century which makes it a perplexing problem to solve. Obviously, growth and tech stocks are overbought, but the trend correction isn’t obvious. Growth and the big internet stocks could underperform for a few weeks like they have intermittently in the past few years or this could be the end of the trend. Growth could underperform value for years and the FANG trade could be over.
The chart below doesn’t solve this puzzle, but it does show that when the top 5 S&P 500 firms get a high weighting, the odds of the equal weight index outperforming the normal market weight portfolio increase. This is a very tame way to look at potential crashes in major stocks, but it is valuable to review because some people who don’t want to make big bets might just want to go with an equal weight index. Even if you aren’t bearish on the big tech stocks, maybe you just don’t want to be overweight them in your passive investments.
Global Sentiment All In On Tech
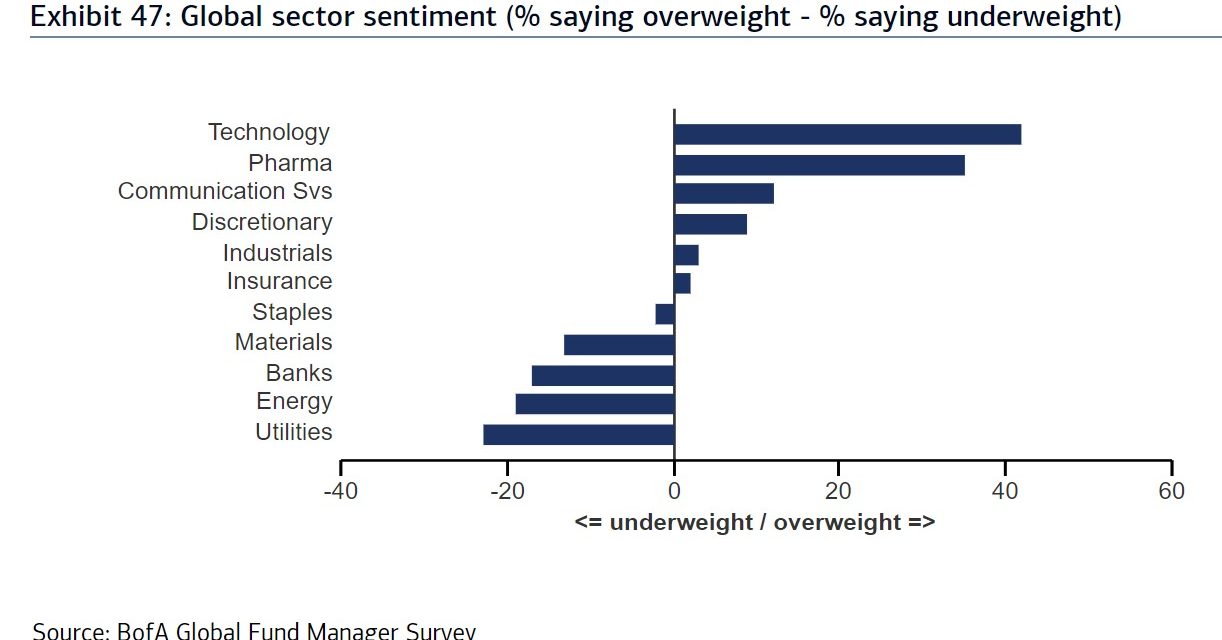
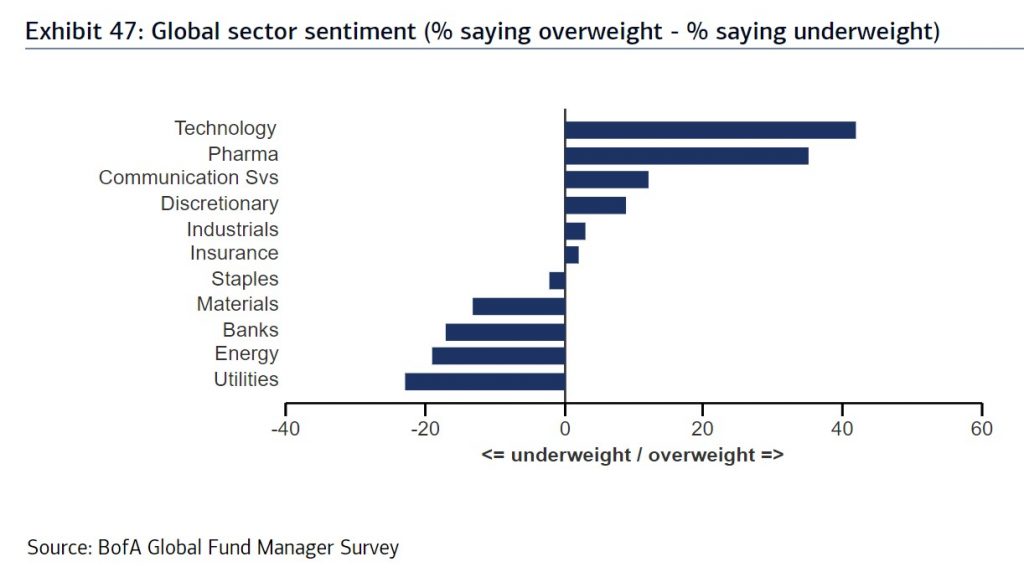
The curious aspect of these surveys is usually fund managers are long the most crowded trade. You’d think they wouldn’t want to follow everyone over the cliff each month, but they do. As you can see from the chart below, despite almost everyone saying U.S. tech is the most crowded trade, a net low 40s percent were overweight tech. It was in the high 30s for pharma because of speculation in the telemedicine and biotech stocks. Telemedicine companies help people get treatment from home and the biotech companies are working on a cure for COVID-19. Consumer discretionary is positive mostly because of Amazon (Amazon is 50% of the sector). On the other hand, investors are the most underweight utilities despite low interest rates. Investors are not interested in this boring sector as they are betting on momentum.
Conclusion
The big internet names are far above their 200 day moving averages as fund managers and retail investors pile into them. As an individual, you don’t need to feel pressured to join in. As an example, you can invest in cash for 2 years if you want because it’s your money (not a recommendation). Sometimes cash is a good idea because it gives you optionality. Managers think tech is crowded, but they can’t help themselves. Not owning the FANG stocks has been a recipe for underperformance for years. However, you don’t need to worry about underperformance. You just need to meet your personal financial goals.
Have comments? Join the conversation on Twitter.
Disclaimer: The content on this site is for general informational and entertainment purposes only and should not be construed as financial advice. You agree that any decision you make will be based upon an independent investigation by a certified professional. Please read full disclaimer and privacy policy before reading any of our content.


