UPFINA's Mission: The pursuit of truth in finance and economics to form an unbiased view of current events in order to understand human action, its causes and effects. Read about us and our mission here.
Reading Time: 5 minutes
Usually investors like to fade sentiment surveys because when the crowd is leaning in one direction, the pain trade is a reversal. The huge long position in oil this year eventually led to a 40% decline in WTI from the October high. The highly positive equity sentiment in January 2018 led to a correction. On the contrary, the Merrill Lynch fund managers’ survey has a great track record of predicting results.
As you can see from the chart below, the long FAANG trade was considered the most crowded trade in the summer and fall of this year.
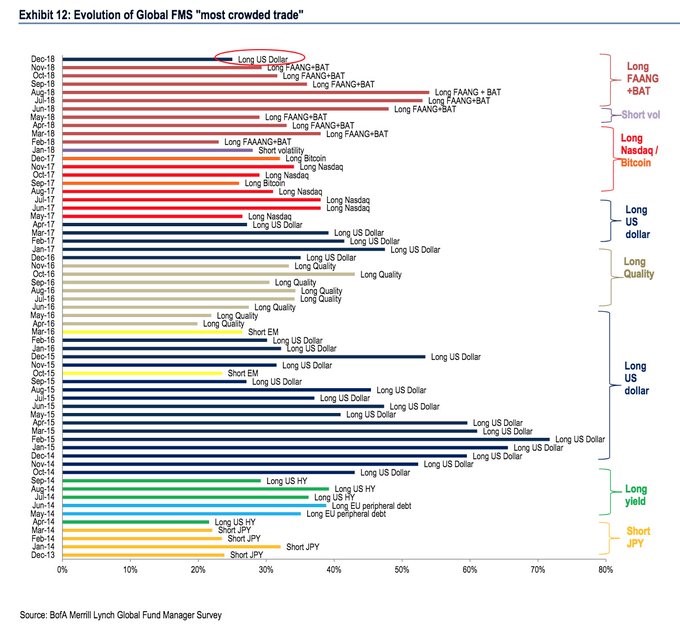
Source: Merrill Lynch
Each stock in that grouping has subsequently fallen over 20% from its high. This survey named short volatility and long bitcoin as the most crowded trades before they reversed as well. Now the most crowded trade is long the U.S. dollar. It didn’t garner a huge percentage like long FAANG did earlier this year, but it’s still noteworthy. Two potential catalysts for a weak dollar could be the Fed ending its rate hikes and U.S. economic growth slowing.
Global Economic Weakness, But No Recession?
The December survey on the global economy is curious. As you can see from the top chart below, only about 10% of respondents think there will be a global economic recession in 2019.
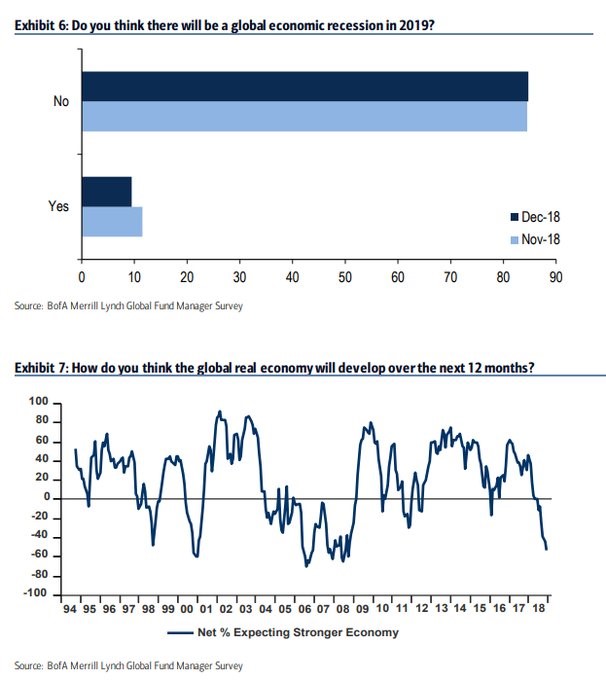
Source: Merrill Lynch
On the other hand, the bottom chart above shows the lowest net percentage of fund managers since 2008 think real global growth will improve in the next 12 months. These two charts don’t necessarily contradict each other because growth can slow without a recession.
That being said, we think it makes more sense to trust the bottom chart than the top one. It is very difficult to model recessions. Fund managers don’t want to make that tough prediction. It’s rare for so many fund managers to be bearish on future growth without a recession happening afterwards. On the other hand, if fewer fund managers expect growth to be stronger than when the survey was issued in 2008, that doesn’t mean this global recession will be worse than that one. The final aspect to note is this survey was very weak in 2006, meaning it was a tad early. There could be a global recession in 2020 or 2021, if this signal is early again.
Consumer Expectations Signal A Recession Is Coming
The consumer expectations index minus the current situation index in the consumer confidence report is signaling a recession is coming. Keep in mind, we’re not saying the consumer is currently weak. In the Redbook same store sales report, year over year growth was 7.1% in the week of December 15th. Growth of 7.9% during the week that included Black Friday was a 13 year high. November year over year retail sales growth was 4.2%. It was 4.6% ex-autos and ex-gas. Online sales were up 10.8% year over year.
We are reviewing where consumer spending is headed by showing the differential between expectations and the current situation. As you can see from the chart below, the current differential is worse than the last cycle, but still higher than the 1990s cycle. Recessions come after this indicator bottoms, and there isn’t much room for it to fall further.
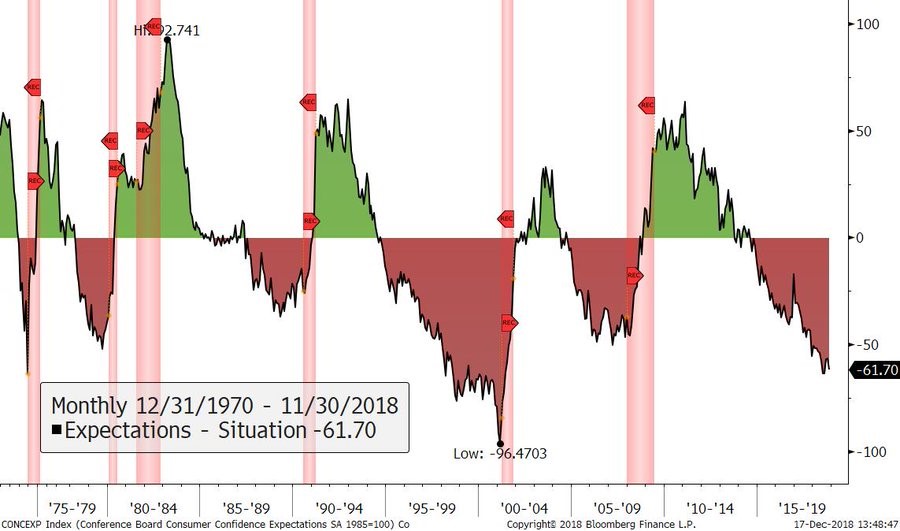
Source: Bloomberg
Housing Market Index Crashes
The December housing market index was a disaster as it fell from 60 to 56. This was below the consensus for 61 and below the low end of the consensus range which was 58. The index had fallen 8 points in November as well. The single family current sales index fell from 67 to 61. It was 80 last December. This is the weakest reading since May 2015.
The index of single family sales for the next 6 months fell from 65 to 61 which was the worst reading since March 2016. Finally, the traffic of prospective buyers index fell from 45 to 43. Since it is below 50, that means it is contracting. This is down from 58 in December of last year. It’s the weakest reading since March 2016. The Northeast had the weakest reading as it was 37. The other 3 regions were above 50 as the West’s index was 65.
As you can see from the chart below, the home builder sentiment reading leads the 3 month moving average of year over year consumer spending growth.
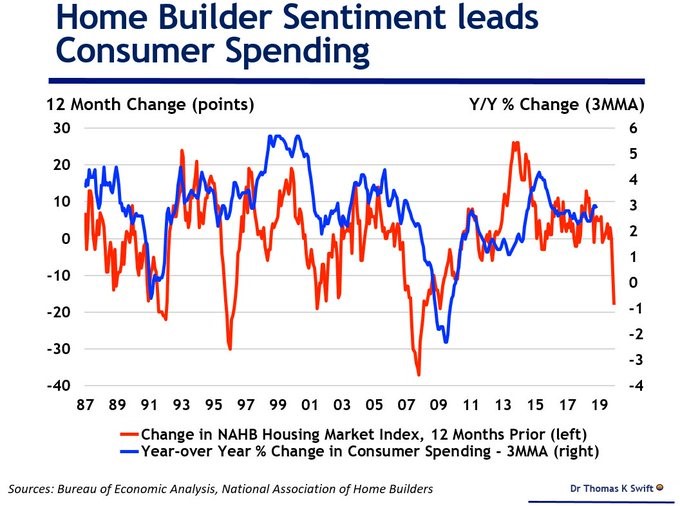
Source: Dr. Thomas K Swift
This chart shows the home builder sentiment index 12 months ahead of consumer spending to make the predictive power easier to see. It’s not a good combination to have a big negative differential between expectations and the current situation index and home building sentiment cratering. The consumer could have a rough time in the next 1-2 years.
Decent Housing Starts
The good news is seasonally adjusted November housing starts and permits increased from October. As you can see from the chart below, housing starts increased from 1.217 million to 1.256 million which beat estimates for 1.221 million.

Source: Econoday
Housing permits increased from 1.265 million to 1.328 million. This beat estimates for 1.255 million. It’s great for starts and permits to increase because starts are very low compared to previous cycle peaks. The strength was in multi-family units as starts increased from 353,000 to 432,000 and permits increased from 418,000 to 480,000. Completions rose from 279,000 to 327,000.
On the other hand, single family starts fell from 864,000 to 824,000 and permits were up slightly. Completions fell from 816,000 to 772,000. The bad news for GDP growth is that single family housing starts boost residential investment more than multi family starts.
Is Housing Affordable?
Bespoke Investment Group challenges the narrative that housing is terribly unaffordable even though surveys show it is unaffordable and shelter inflation has routinely been above wage growth this cycle. The top chart shows new ownership costs are only 20.69% of pre-tax median family income. However, this indicator shows the housing bubble peak didn’t have a very high unaffordability rate, which is a dubious claim.
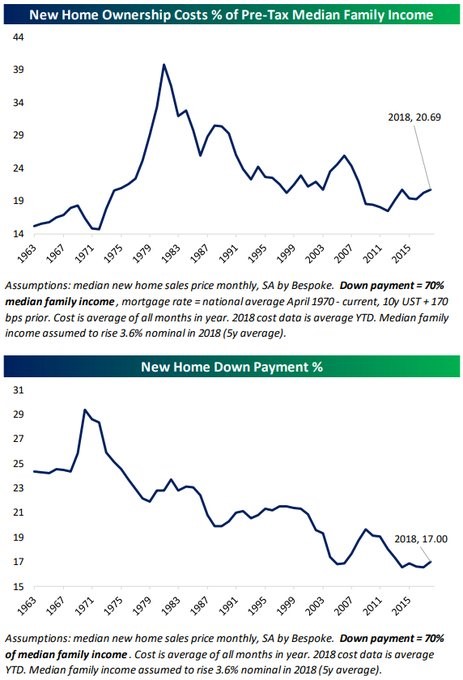
Source: Bespoke Investment Group
The bottom chart above shows if a new home down payment is 70% of median family income, the percent people can put as a down payment has fallen. Even with this decline, the all-in cost shown in the top chart is manageable.
Conclusion
Being long the dollar is the new most overcrowded trade. Fund managers agree that growth will slow, but few think there will be a recession in 2019. Future consumer sentiment minus the current situation and the home builder sentiment index imply consumer spending growth will decline. Housing starts and permits improved in November. The bad news is housing starts fell 3.6% year over year and permits were only up 0.4%. Furthermore, multi family starts and permits were strong, but they were weak for single family homes. Bespoke Investment Group shows us analysis which says the all-in cost of homes is affordable.
Have comments? Join the conversation on Twitter.
Disclaimer: The content on this site is for general informational and entertainment purposes only and should not be construed as financial advice. You agree that any decision you make will be based upon an independent investigation by a certified professional. Please read full disclaimer and privacy policy before reading any of our content.


