UPFINA's Mission: The pursuit of truth in finance and economics to form an unbiased view of current events in order to understand human action, its causes and effects. Read about us and our mission here.
Reading Time: 4 minutes
The economic data is starting to come in. It’s terrible. The only good news is as economists and investors start to project out borderline depressionary numbers, expectations will be easier to beat. Further good news is human testing for a COVID-19 vaccine has begun. In keeping with the point that the estimates have dealt with the ‘kitchen sink’, which means everything that can go wrong is being expected, Goldman Sachs expects -5% Q2 GDP growth; such weakness has only happened 5 times since 1960. Pantheon Macro believes discretionary spending will fall 20% in Q2 which will hurt growth by 8 points alone. Every estimate has become believable in this stressed situation for consumers, healthcare workers and everyone at the front lines fighting this virus. In the March BAML investor survey, there was the biggest monthly drop in global growth expectations ever. 23% expect growth to get stronger in the next year and 72% expect it to get weaker.
There is no question the economic data will be bad in March. The chart below shows the yearly growth in road travel time as measured by TomTom. As you can see, the U.S. average yearly growth rate is near -10%, with Seattle lagging the furthest.
It’s no surprise driving is slowing since states are implementing curfews and municipalities are asking people to stay inside unless they need to go out (buy food or medical needs). The chart doesn’t show the full extent of the domestic shutdown that will take place in the 2nd half of March into April.
Fewer people are commuting to work as some people are working from home and some people have been told not to work for a few weeks (furlough). Restaurants are being shutdown which means the decline in same store sales growth is picking up steam. The chart below shows yearly bookings growth with an app called OpenTable. Growth in America is almost -50%.
For context, McDonald’s stock is down 31% from its peak; it only fell 31.6% from its peak in the financial crisis. We aren’t saying it’s a relative buy. We’re saying it’s getting hit much harder this time around. In 2008, some people may have used fast food to trade down because they didn’t have a lot of discretionary income. Now community gatherings are being shunned or shutdown which is hurting the firm more than a normal recession would.
The Real Data Is Bad Too
Not only is the non-traditional data such as restaurant sales and miles driven bad, the traditional data is terrible as well. As you can see from the chart below, the Empire Fed manufacturing index fell from 12.9 to -21.5 which was the biggest monthly drop ever.
Manufacturing went from recovering from a recession to going right back in one. This was the weakest reading since March 2009. For context, the index bottomed at -34.3 in the last recession. This index is the equivalent to an ISM PMI of 42.9. The expectations index fell from 12.9 to 1.2 which was the weakest reading since February 2009 when it bottomed at -5. The manufacturing sector is in a recession like the rest of the economy.
We Must Look For Green Shoots
In a situation where markets are cratering, we must look for reasons to be optimistic because valuations are cheaper. While it’s true that we don’t know how weak earnings will be in 2020, we know that stocks usually overreact to short term events. The best news is the quarantine in Italy is working which means it will likely work in America. On March 14th, 15th, and 16th, the number of new COVID-19 cases were 3,497; 3,590; and 3,233.
You should come up with reasons to be bullish in times of extreme uncertainty. As of Monday, the stock market had 3 straight days of 9% movement or more and 6 straight days with 4% movement or more. Those streaks are both the most since the Great Depression. The VIX hit its highest level ever on Monday and stocks fell the 3rd most ever (down 11.98%).
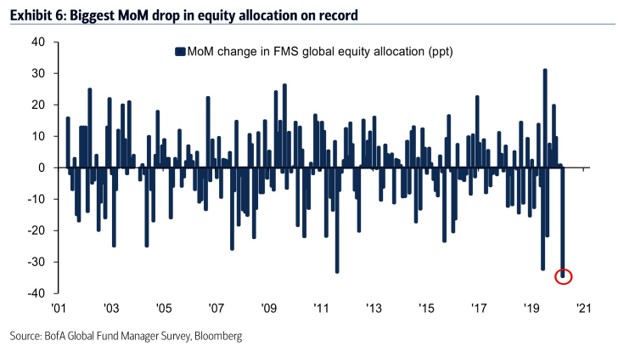
Investors Are Very Bearish
Investors are extremely bearish. As you can see from the chart below, fund managers’ global equity allocation fell 35 points which is the biggest month drop on record (going back to 2001).
Investors are so bearish that the XHB home builder ETF fell 15.5% on Monday. That was its biggest drop ever. Its biggest drop during the housing bubble burst was 12%. While, some might argue this period is worse than the financial crisis, it’s not worse for the housing market unless rates were the spike. There have been 12 S&P 500 moves of more than 3% in the past month which is the most since 1950 outside of the financial crisis. In October 2008, the peak was 14. This period is like the shock of 9-11, in terms of uncertainty and death, combined with the swift decline of 1987.
Global profit expectations are the worst since the financial crisis and fund managers added almost as much in cash as they took away in equities. You can see that play out in the chart below which shows the percentage of S&P 500 stocks above their 200 day moving average.
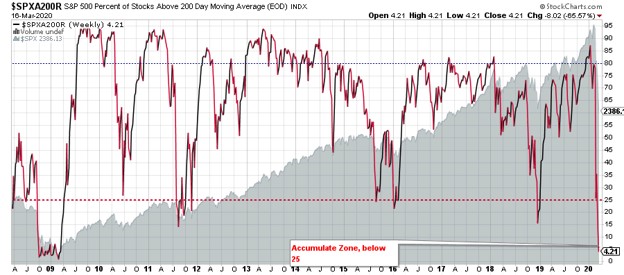
Only 4.21% of S&P 500 stocks are above their 200 day moving average which is the lowest since the financial crisis. 7.01% of Nasdaq stocks are above their 200 day moving average which is above the financial crisis trough of 5.23%.
Conclusion
The economic data is just starting to come in. It’s terrible. The good news is stocks have mostly priced in a recession and forecasts are starting to get extremely bleak. There needs to be seemingly no sign of optimism for stocks to bottom. The reality is there are plenty of potential positive catalysts, such as the growth of new cases in America slowing in the next few weeks because of the quarantine and a fiscal stimulus. The best potential catalyst is lower prices. When markets price in the worst case scenario, there is little that can push them lower. Having only 4.21% of S&P 500 stocks above their 200 day moving average is an extremely oversold moment, but doesn’t mean this is the bottom.
Have comments? Join the conversation on Twitter.
Disclaimer: The content on this site is for general informational and entertainment purposes only and should not be construed as financial advice. You agree that any decision you make will be based upon an independent investigation by a certified professional. Please read full disclaimer and privacy policy before reading any of our content.


