UPFINA's Mission: The pursuit of truth in finance and economics to form an unbiased view of current events in order to understand human action, its causes and effects. Read about us and our mission here.
Reading Time: 4 minutes
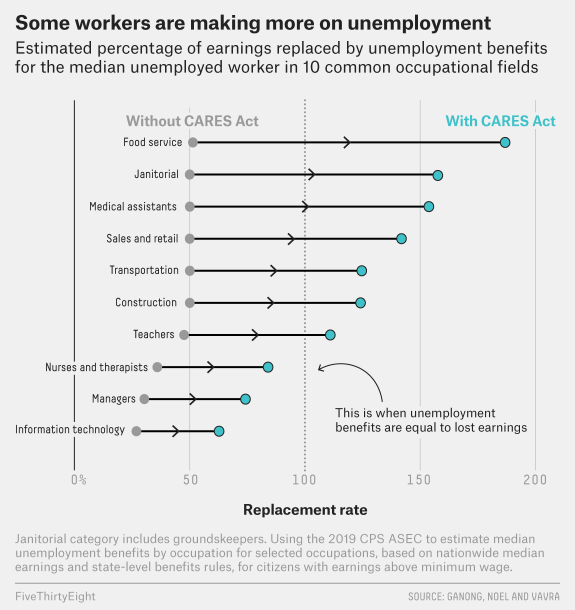
The April PCE report will go down in history as the most unusual ever because government transfer payments boosted income, while uncertainty and the inability to go out thwarted spending. That’s partially why people had the money to buy stocks. They couldn’t spend it on anything else. Plus, many people who have lost their jobs aren’t paying rent. The chart below details the median unemployed worker’s income in 10 common occupational areas. 68% of people who are unemployed are making more money than they would with their normal job.
As you can see, food service workers are getting paid almost double than normally. The situation will reverse course once the CARES Act benefits expire at the end of July. It would be a major policy blunder if the government allows millions of people to lose these benefits before the labor market sufficiently recovers. We think it makes sense to have a bridge where the payment is lowered, but still helps people in the months before they can get a job. The worst case scenario is no benefits are added and there is a 2nd wave of COVID-19. With the November election in play, you would think both parties would want to do whatever it takes to avoid economic discomfort. Plus, it’s good policy to prevent lasting damage.
You will never see anything like this again. 5 year annualized real personal income growth net of government transfer payments is 0.71%. Once a couple more weak data points are added to this average, it will blow past the previous record low of -0.31% in December 2009. As you can see from the chart below, government social benefits as a percentage of personal income increased from near 17% to above 30%. The percentage had been rising on a secular basis because of the increase in social programs, increase in inequality, and the aging population. This spike will reverse course when the extra $600 in unemployment benefits expire and more so when people get their jobs back.
Worst Decline In Spending Ever
April consumer spending fell 13.6% monthly which fell from a 7.5% decline and missed estimates by 1 point. This was the biggest decline ever. Yearly growth was -17.3%. Consumer spending has fallen 19% in the past 2 months. The worst hit industries were recreation which was down 60% and food & accommodations which fell 52%. Three categories had a 1% increase. They were financial & insurance, food & beverages, and housing & utilities. Motor vehicle and parts sales fell 32%. That’s the biggest category of the retail sales report. Overall, quarterly annualized PCE is expected to fall 49% in Q2.
Spending on healthcare has fallen 40%. You can see in the chart below, the decline in healthcare service spending has taken away years of increases.
Spending on healthcare never falls in recessions, but it did in this one because of the decline in elective surgeries. To be clear, most elective surgeries aren’t superficial like some plastic surgery can be. We’re talking about people who are delaying surgeries which causes them serious discomfort and long term health issues. For example, someone might be in pain for a few months because they delayed a hip replacement. Most of this spending that was delayed will come back. There could be an uptick in mental health spending because of the impact the shutdown has had. There’s almost nothing worse than facing economic hardship along with fear for a loved one’s health and not being able to see family and friends in person.
Income & Savings Increase
Real disposable income growth was 13.4% monthly and 13.8% yearly. Personal income growth was 10.5%. That’s the highest growth ever. It’s amazing that we have seen the best growth in a recession. This shows how powerful the unemployment insurance payments were. Because of the uncertainty and the extra income, the personal savings rate spiked to 33% from 12.7% which was the highest rate ever. The 10 year high had been 12% and the record high was 17.3% in May 1975.
There is pent up demand as people want to go back to normal. People want to go outside and spend money more now than ever. The fact that people have money saved up should help them act on their desires. Plus, the spike in the stock market should encourage optimism. The consumer wasn’t overly indebted before this recession. This recession served to further the long term deleveraging cycle. As you can see from the chart below, consumer credit had been falling for the past 3 months. Once the data from April and May is included in this chart, the decline will look even more drastic.
Inflation Falls
Both headline and core PCE inflation were negative on a monthly basis as they were -0.5% and -0.4%. It’s interesting that in spite of the decline in prices, consumers are expecting more inflation. As you can see from the chart below, the University of Michigan survey shows a spike in 5 year inflation expectations to 2.7% which is above its previous 4 year range. Headline and core inflation were 0.5% and 1% yearly. Oil prices had their largest spike ever in May which means headline PCE inflation might rise above core inflation again. Consumers might expect higher inflation because of the prices they are seeing at the supermarket or because they think the debt fueled stimulus will cause the value of the dollar to decline (the dollar has been strong).
Conclusion
This was the most unusual PCE report ever because income growth spiked to a record high and spending fell the most ever. The savings rate spiked to a record high and consumers likely paid down debt like they had been doing in previous months. Consumers expect higher inflation even though inflation fell in April. The Fed is nowhere near hiking rates; it would be in a bind if inflation rose. The Fed would be forced to deal with the high inflation because the economy is too weak to handle rate hikes.
Have comments? Join the conversation on Twitter.
Disclaimer: The content on this site is for general informational and entertainment purposes only and should not be construed as financial advice. You agree that any decision you make will be based upon an independent investigation by a certified professional. Please read full disclaimer and privacy policy before reading any of our content.


