UPFINA's Mission: The pursuit of truth in finance and economics to form an unbiased view of current events in order to understand human action, its causes and effects. Read about us and our mission here.
Reading Time: 4 minutes
Normally as the stock market rises, investor optimism increases. However, in this run there has been extreme skepticism because the unemployment rate is so high, there are riots in the streets, rhetoric against China is heating up, and the global pandemic isn’t over. That’s perhaps the worst combination of negative headlines we’ve ever seen. The stock market always climbs a wall of worry when it rises, but this increase has been a bit more extreme because the worries have become reality.
The decline and subsequent recovery in stocks have been quick as traders priced in a complete shutdown before it happened and then priced in a full recovery before it has happened. For example, the stock market bottomed on March 23rd which was 1 day after NYC shutdown. Stocks began selling off as the virus spread in Italy and cases started appearing in America. Once cases in Italy started stabilizing, the stock market started rising. As America’s daily new cases falls and states reopen, the rally in stocks has accelerated.
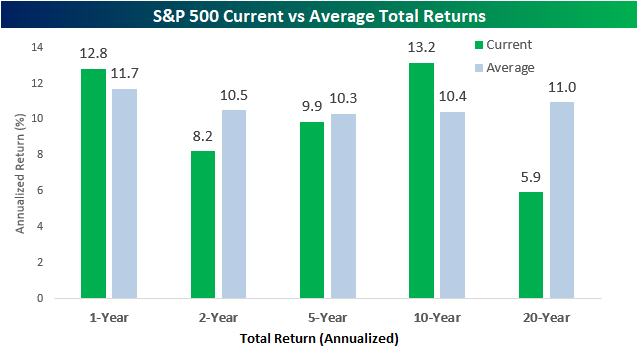
As you can see from the chart above, the S&P 500’s current past 12 months of returns have been better than average. This chart flummoxes people because they see what’s going on in the news and expect worse returns. Stocks are up because of an improvement in certainty and lower cost of capital. The thesis is that even if there is a 2nd wave of COVID-19, there won’t necessarily be shutdowns because doctors have a better understanding of how to deal with it and citizens know how to social distance. The virus was running rampant in February because little precautionary action was taken. That likely won’t happen in the fall if there’s an uptick in cases. There’s more likely to be an overreaction by citizens because they remember this winter/spring.
We went from traders wondering if companies could raise money, to rampant demand for corporate debt. The improvement in financial conditions allowed Boeing to issue debt rather than get a bailout. This improves valuations. This is an example of the newly popular term “re-rating.” That’s when there is a big change for a security causing investors to sharply push the stock higher or lower quickly. If you do a valuation analysis with a lower cost of capital, the stock instantly becomes cheaper.
Against The Grain
While owning the mega cap tech stocks is incredibly popular, conversely, it’s popular to discuss how large they are as a percentage of the market. Technically, being a large portion of the market isn’t a sell signal. It’s possible they can rise, but underperform for a few months which would adjust their share of the market.
The chart above goes against the grain of showing they have too large a share. The orange bars show the trailing earnings of Apple, Amazon, Netflix, Facebook, Microsoft, and Alphabet as a percentage of S&P earnings. Big cap tech earnings have improved as they have outperformed the rest of the market which justifies their higher market cap share. Their market cap share minus their earnings share is below the peak in 2018. Furthermore, these firms have proven to be more recession resistant than many thought. This recession was tailor made for them though. The main point here is they don’t have too much market share unless you think they have been too big for over 2 years. Their size is not a new phenomenon.
Consumer Spending
As we discussed, consumer spending crashed in April. The good news is it will be much stronger in May. The May consumer sentiment report showed strong improvement in the current index. The overall index rose from 71.8 to 72.3. There was a strong divergence which left it barely changed. The current conditions index rose from 74.3 to 82.3 which is a massive improvement. Consumers see the economy reopening, so they must report they are more optimistic on the present. However, expectations diminished as the index fell from 70.1 to 65.9. The decline is logical because if you’re asking if the economy will improve from April which was terrible, it will obviously improve even if it won’t be great. It’s harder to improve from May’s level which had higher activity.
The chart above, which shows yearly growth in spending with and without a card present, supports the thesis that consumer spending growth is improving in May. As you can see, spending when the card is present, which is mostly in person spending, fell 33.1%. That is actually a major improvement from late March and early April in which spending fell over 50%. The improvement in spending when the card isn’t present, which is online purchases, has been so strong that growth is back to normal. Growth bottomed at about -25%; now it’s at 5.1%. Online shopping undoubtedly took market share from brick and mortar stores. It’s also possible spending without the physical card while at the store took share. Tap to pay is less likely to spread germs than inserting the chip or swiping the card.
The chart below shows how each metro area did in the week ending May 23rd which is obviously very recent. As you can see, card spending was down the least in Phoenix and the most in San Francisco. It’s impressive that spending only fell about 15% in New York as the city hadn’t opened yet. NYC is expected to start opening on June 8th. The data late in May and early June will unfortunately be negatively impacted by the riots/protests. The stock market completely ignored them because traders don’t see them having a long term impact.
Conclusion
When you consider all the negative events that have occurred in the past 3.5 months, it’s shocking that stocks have done better than average. Stocks have done well because investors look past one time events like riots and viruses. It makes sense to own a stock if its cost of capital has suddenly fallen. Obviously, it’s better to forecast this and buy ahead of the rebound. Even still, it’s not the worst idea to own stocks on the upswing. The mega cap tech stocks’ earnings have increased as a percentage of the market’s earnings. That doesn’t make them a buy. It means the arguments that they are too large are incomplete. Consumer spending growth has rebounded significantly. Unless the unemployment benefits end in July and people don’t all get their jobs back by then, yearly spending growth will continue to improve. That’s what the market is pricing in.
Have comments? Join the conversation on Twitter.
Disclaimer: The content on this site is for general informational and entertainment purposes only and should not be construed as financial advice. You agree that any decision you make will be based upon an independent investigation by a certified professional. Please read full disclaimer and privacy policy before reading any of our content.


