UPFINA's Mission: The pursuit of truth in finance and economics to form an unbiased view of current events in order to understand human action, its causes and effects. Read about us and our mission here.
Reading Time: 5 minutes
One of the most fun parts of economics is we don’t have the answers to everything. In fact, the most important thing is asking the right questions. That gives you a better opportunity to have the chance to see the truth most clearly. When a new trend arises, we don’t always know what caused it. The principal reasons we don’t know why trends occur is because people don’t always react as you’d expect and because there are literally hundreds or thousands of potential reasons for actions to occur. The economy is a complex system. It can be something you’d never expect causing certain things.
One example of a trend that hasn’t been accounted for is that people are moving less. Someone can move for many reasons. It can be because of high property taxes or the crime rate increasing in where they live. Starter homes used to be more common which caused people to move more since they weren’t permanent. With housing affordability a problem and people buying their first house later, there’s less need to buy a starter house (and then move into a bigger house). People are also having less children which means there’s less need to move to a bigger house with more rooms.
As you can see from the chart above, this has been a powerful trend as it wasn’t impacted by the housing bubble. The mover rate has been falling since the mid-1980s and didn’t change its trend at all in the 2000s. Most economic data were impacted by the housing bubble. The fact that a housing metric wasn’t impacted by the housing bubble is surprising. As the chart below shows, a lower percentage of people have moved to a different residence in the same county, moved to a different county in the same state, and moved to a different state.
One strong hypothesis about this decline is there is less fluidity in the labor market. There is less geographic movement across labor markets. The service sector has expanded which means the same type of jobs are everywhere. If you want to work in healthcare, you probably won’t need to move to find a job. People get sick everywhere. There are also more jobs where people work from home. You can work from anywhere when you work from home, but it ironically doesn’t cause you to move because you don’t need to be in a certain place.
Philly Fed Index Increases, But There’s Underlying Weakness
The Philly Fed manufacturing general business conditions index increased from 5.6 to 10.4. That beat estimates for 7 and the high end of the consensus range which was 8.7. Remember that these reports are often far from estimates. This report doesn’t suddenly mean the manufacturing sector is doing great. It just means there’s a better chance that the ISM manufacturing PMI improves this month. Recently, the average of the regional Fed indexes has been more positive than the ISM PMI. Their potential optimism in November, might not lead to an improved PMI. As the chart below shows, the 3 month moving average of this index doesn’t look nearly as bad as industrial production growth or the ISM PMI.
The headline indicator in the Philly Fed report isn’t a composite. It’s the Fed asking firms about their current business activity. 30.3% of firms said they saw an increase in activity and 19.9% said they saw a decrease. This explains how the headline index rose while the new orders and shipments indexes both fell sharply. The new orders index fell from 26.2 to 8.4 and the shipments index fell from 18.9 to 9.8. This is a normalization as October’s report was weird. This month the new orders and shipments indexes were near the general conditions index. It was odd to see the new orders and shipments indexes at 26.2 and 18.9 last month while the general activity index was only at 5.6.
The new orders index in the ISM report goes directly into the leading indicators index, so it is very important. Those calling for a bottom in manufacturing activity, might want to hold off because of these weak underlying numbers in the Philly Fed report. The good news is the Philly Fed’s expectations index increased from 33.8 to 35.8. The new orders index was up 0.4 to 40.3 and the shipments index fell 1.5 to 41.4. Exactly the opposite of the Empire Fed reading, the capex index was down sharply as it fell from 36.4 to 19.4.
Jobless Claims Stay Slightly Elevated
Initial jobless claims were 227,000 in the week of November 16th which matched the modestly elevated number last week. It was 10,000 above the consensus. The consensus might have been low because last report included estimated data. It turned out that the estimates didn’t cause the spike as there weren’t estimates in this report and it was the same (plus last week’s report was revised 2,000 higher). The 4 week moving average of claims increased from 217,500 to 221,000 which is the highest average since June. This report covered the sample week of the monthly BLS employment report. There was a 9,000 increase compared to last month’s sample week. The November employment report comes out on December 6th.
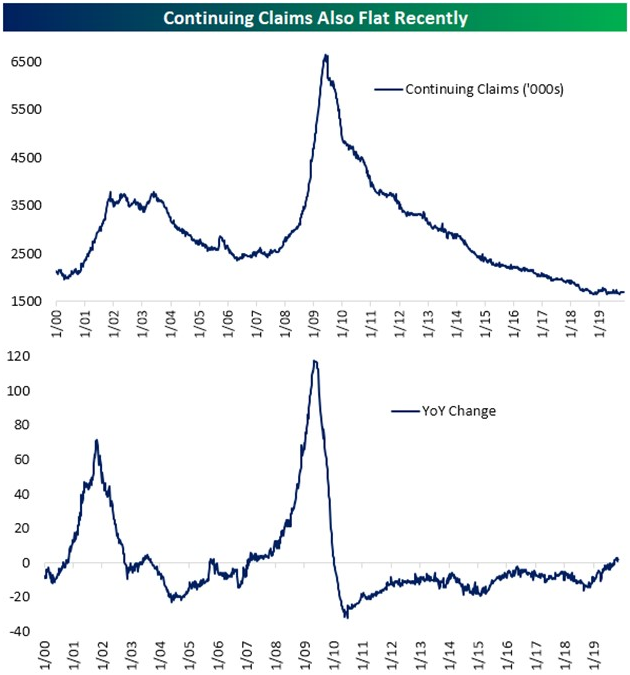
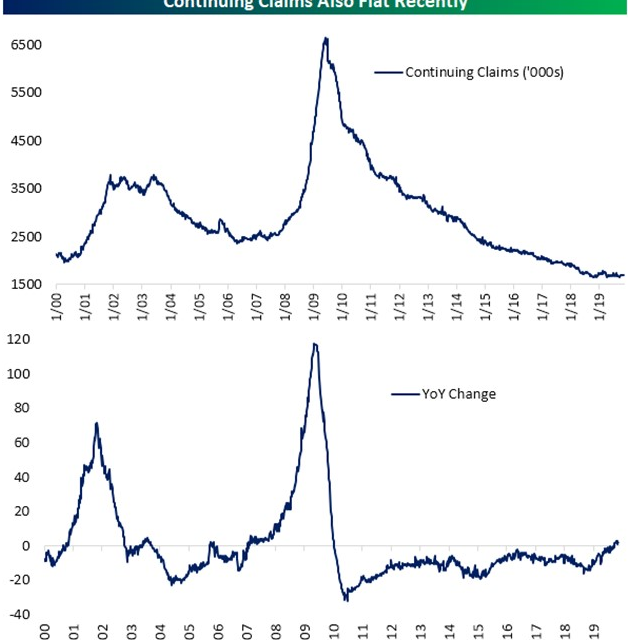
Continuing claims have been increasing modestly as well. This reading comes out a week after initial claims. Continuing claims increased to 1.695 million which pushed the 4 week average to 1.693 million; that’s the highest average since August. The bottom chart above shows growth in continuing claims has gone slightly positive. There needs to be a greater spike in both types of claims before you should fear a recession. It’s not good that initial claims are rising because that hurts the leading indicators index.
Leading Indicators Almost Give Recession Warning
Anytime yearly growth in the leading indicators index turns negative it’s a recession warning. In October, yearly growth stayed at 0.3%. That’s the same growth rate it bottomed at in 2016. The 6 month trend turned negative for the first time in 3 years. As you can see from the bottom chart below, the 6 month rate of change was -9 basis points which is nearly a cycle low.
The 0.1% monthly decline in the leading indicators index was driven by weakness in manufacturing new orders, average weekly hours worked, and jobless claims. The Philly Fed index had a decline in its new orders index and the two November jobless claims reports showed weakness. If the ISM manufacturing new orders index falls, it will hurt the leading indicators index. The S&P 500 is part of the leading index as well. It was up 2.04% in October. It is currently up 2.17% in November. A correction in stocks, continued slightly high jobless claims, and a decline in the new orders index combined would likely cause this index to give off a recession warning.
Conclusion
People are moving less in general and are also moving less within their states and across the country. The labor market is less dynamic. There’s less of a need to move if the same jobs are everywhere. The Philly Fed index improved, but the new orders index and shipments fell. Initial and continuing claims increased, but it’s still not a recession signal. However, this weakness could cause the leading indicators index to signal a recession since it’s already weak.
Have comments? Join the conversation on Twitter.
Disclaimer: The content on this site is for general informational and entertainment purposes only and should not be construed as financial advice. You agree that any decision you make will be based upon an independent investigation by a certified professional. Please read full disclaimer and privacy policy before reading any of our content.


