UPFINA's Mission: The pursuit of truth in finance and economics to form an unbiased view of current events in order to understand human action, its causes and effects. Read about us and our mission here.
Reading Time: 4 minutes
The stock market had a major bottom on Christmas Eve as the Fed turned dovish and investors realized a recession wasn’t in the immediate future. The extraordinary rally in the first two months of 2019 is tough to gauge because earnings estimates crashed in January and most economic readings haven’t been great. For example, global manufacturing hit a 32 month low in February as its PMI fell to 50.6. February light vehicle sales were down 2.3% year over year. The economic surprise index is at -43.4 which is the worst reading since mid-2017. CNBC’s median tracking estimate for Q1 GDP growth is only 1%.
Even with that subpar performance, the Dow has had its best start to a year since at least 1987. It has been driven by Boeing which has catalyzed 30% of the gains. Boeing is having the best start to a year for a Dow stock since Microsoft in 2001. As you can see from the chart below, each sector is performing almost exactly the opposite as it did in Q4 2018. The biggest losers have become the biggest winners.
Usually the stocks at the epicenter of a recession recover the quickest. This time there wasn’t a recession in 2018, but the economy also hasn’t recovered. Stocks went down too quickly and recovered too quickly as if they are ignoring much of the economic data and earnings guidance.
Earnings Estimates Have Been Weak
2019 earnings estimates have collapsed, but earnings still won’t be terrible. Earnings are balanced out by the decent revenue growth estimates. Essentially, earnings aren’t close to strong enough to justify this rally, but they aren’t weak enough to justify the 20% decline in late 2018. The weak earnings estimates and stock market rally have pushed the S&P 500’s forward PE ratio to 16.03 which is up from 13.92 to start the year.
As you can see from the chart below, earnings estimates for Q1 have fallen 3.76% as 62% of firms had their estimates cut.
The Q4 2015 earnings season caused the 4.8% decline in Q1 2016 estimates you see above. That was the biggest decline of that earnings recession. According to The Earnings Scout, this won’t be an earnings recession because estimates are for -0.16% growth in Q1 and 2.28% growth in Q2. Growth will accelerate to 9.99% in Q4 because of the weaker comparisons. If growth is only expected to be slightly negative, actual results should push it positive because estimates are almost always beaten.
FactSet’s numbers are worse. They show Q1 2019 estimates fell 6.5% which is the biggest decline in the first two months of a quarter since Q1 2016 when estimates fell 8.4%. Energy, materials, and technology saw estimate declines of 32.3%, 15.2%, and 8.2%. Even though FactSet shows earnings are expected to fall 3.2% in Q1, revenue growth is expected to be 5.2%. That’s solid enough growth to make this a phantom earnings recession. There’s no reason for stocks to fall 20% again, but the results are negative enough to question this rally which has been built on multiple expansion.
Homeownership Actually Increases
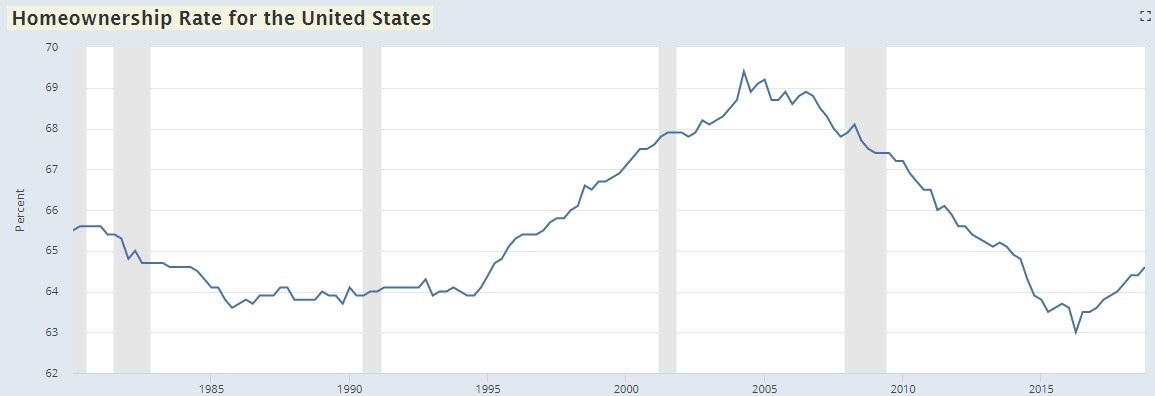
The latest consumer sentiment report showed plans to buy a home are the lowest since July because people think homes aren’t affordable. The housing reports were weak in all of 2018, and especially so in Q4 2018. Mortgage interest rates increased in 2018 and peaked in Q4 2018. Even with all those issues, the chart below shows the homeownership rate increased in 2018 to a more historically normal level. In Q4 2017, the homeownership rate was 64%. It increased to 64.6% by the end of 2018 with a 0.2% increase in Q4.
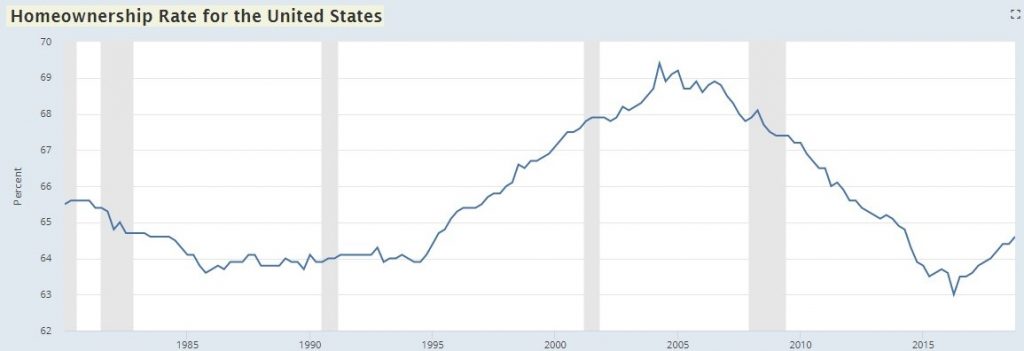
The rate bottomed this cycle at 63% in Q2 2016, hitting the lowest level since at least 1980. Even with this increase in the homeownership rate, housing debt fell in Q4 from $9.56 trillion to $9.54 trillion. Plus, the personal savings rate increased in December to 7.6% from 6.1%. The biggest credit goes to accelerated real wage growth, with the fastest growth received by lower income workers. Those workers have seen their employment to population ratio increase, helping them reach the American dream by buying a house. This time, purchases are by well qualified buyers. This rate won’t plummet in the next recession like it did prior to, during, and after the last recession.
Household Growth
Despite millennials having a tough time buying a house and forming households, the homeownership rate and household formation growth have returned to historically normal levels. As you can see from the chart below, the 5 year average growth in household formation is similar to the growth from 2001 to 2005.
There is a cyclicality to household formations, but the Great Recession took this to another level as the huge decline in the homeownership rate caused by the housing bubble bust prevented households from being created. Now population growth is creating more demand for housing which is a problem because housing starts have been low this expansion.
Inflation Weakness
As we mentioned, global manufacturing is weak. It’s also weak in America as the Markit PMI fell to 53 which is an 18 month low. The ISM PMI fell to a 2 year low of 54.2. Technically, that’s consistent with 3.3% quarter over quarter GDP growth, but that’s low for this index. The chart on the left shows it’s the equivalent to 2.8% year over year GDP growth.
The chart on the right shows somewhat good news. Delivery times and prices paid fell more than production and new orders which shows there aren’t capacity constraints, and inflation is decelerating. However, demand is also weakening, so it’s far from a perfect picture.
Conclusion
It’s amazing to see such a reversal as stocks fell sharply without evidence of a recession and then rallied sharply without evidence that the slowdown is over. Earnings won’t be a disaster in 2019, but they won’t be good enough to prevent a sharp multiple expansion if stocks maintain their gains. It’s amazing to see the homeownership rate continue its march higher despite the weak housing market in 2018. Since mortgage rates have fallen and real wages have increased, we should see the homeownership rate increase in Q1 2019. That supports the growth in household formation. Finally, the global manufacturing economy is barely growing. America is outperforming, but growth is weak. The good news is capacity constraints have been eliminated and inflation is modest.
Have comments? Join the conversation on Twitter.
Disclaimer: The content on this site is for general informational and entertainment purposes only and should not be construed as financial advice. You agree that any decision you make will be based upon an independent investigation by a certified professional. Please read full disclaimer and privacy policy before reading any of our content.


