UPFINA's Mission: The pursuit of truth in finance and economics to form an unbiased view of current events in order to understand human action, its causes and effects. Read about us and our mission here.
Reading Time: 4 minutes
This article will mostly consist of economic analysis, but we would be remiss to ignore the latest stock market rally for 2 reasons. First, economic analysis is partially done to forecast equity returns. Second, stock returns affect consumer and small business confidence, meaning they affect the economy through reflexivity. The stock market is very overbought as of early March as the S&P 500 is up 11.84% year to date, the CNN Fear and Greed index is at 70 out of 100 which signals ‘greed’, and the Nasdaq is on a 10 week winning streak.
As you can see from the chart below, the AAII investor survey shows the percentage of bears has fallen to just 20% which is the lowest since January 2018 when investors had record high euphoria.
The good news for the market is the percentage of bulls is at 41.6% which is about 20% lower than that euphoric peak. To be clear, euphoria is bad for returns as everyone being ‘all in’ means there are few investors left to turn bullish to push valuations higher. Bull markets are built on skepticism and die from euphoria.
Long Awaited Q4 GDP Report Is Here
The Q4 GDP report was delayed by the government shutdown. The slight controversy when analyzing this report is the battle between those who follow quarter over quarter annualized growth and those who follow year over year growth. Both rates are important. Quarter over quarter growth is the most highly cited, which means we will show annual growth in the chart below to present a fuller picture.
There was controversy this quarter because the picture is sharply divergent depending on how you review it. Quarter over quarter growth was 2.6% which beat estimates for 2.2%. However, it was the 2nd straight quarter with lower growth than the previous one. The chart above shows annual growth was 3.08% which was the strongest growth since 2015. For all of 2018, growth was 2.9%. This differentiation may be old news anyway because Q1 growth is expected to be poor. The Atlanta Fed Nowcast’s first estimate is for only 0.3% quarter over quarter growth and the NY Fed is at 0.88%.
Specifics Of The GDP Report
The GDP price index was 1.8% as inflation remained tepid which is great for the Fed which wants to remain patient with rake hikes. Real consumer spending growth was 2.8%. The chart on the right shows the contributions each segment made to growth.
Consumer spending helped GDP growth by 1.92%, making it the largest contributor. Real residential investment growth was the weakest part of this report as it was driven lower by the weak housing market. Growth was -3.5% in Q4; it was negative in every quarter in 2018. December housing starts missing estimates by the most in 12 years is far from ideal.
The best part of this report was business investment growth of 6.2%. As you can see, the green bars got smaller in Q2 and Q3 which made economists think the boost from the corporate tax cut and repatriation holiday was over. It added 0.82% to GDP in Q4. The biggest help to this category was intellectual property investment growth which was 13.1%. That’s the strongest growth rate since Q1.
As you can see from the chart below, research and development spending growth was 13.5% annualized.
Private R&D spending is 2.3% of GDP. This secular increase confounds economists because productivity growth has been moribund this cycle. It was 0.95% in Q1 and 1.28% in Q2 and Q3.
Government spending growth was 0.4%. Inventories added 0.13% to GDP and trade pulled down GDP by 0.22%. These categories can manipulate results away from showing how the economy truly did, but they didn’t this quarter. This report was relatively solid, and the headline print was relatively solid.
Full PCE Report & Personal Incomes From January
On Friday, the delayed full PCE report from December came out along with only the data on incomes from January. Income growth was amazing in December, but not so much in January. December monthly growth was 1% which beat estimates for 0.4% and the 0.3% growth in November. January’s growth was -0.1% which missed estimates for 0.3% growth. January had a tougher comparison than expected. Both reports were solid despite the big swing because January income growth was brought down by proprietors’ income and return on assets. Wages and salaries growth was 0.5% in December and 0.3% in January.
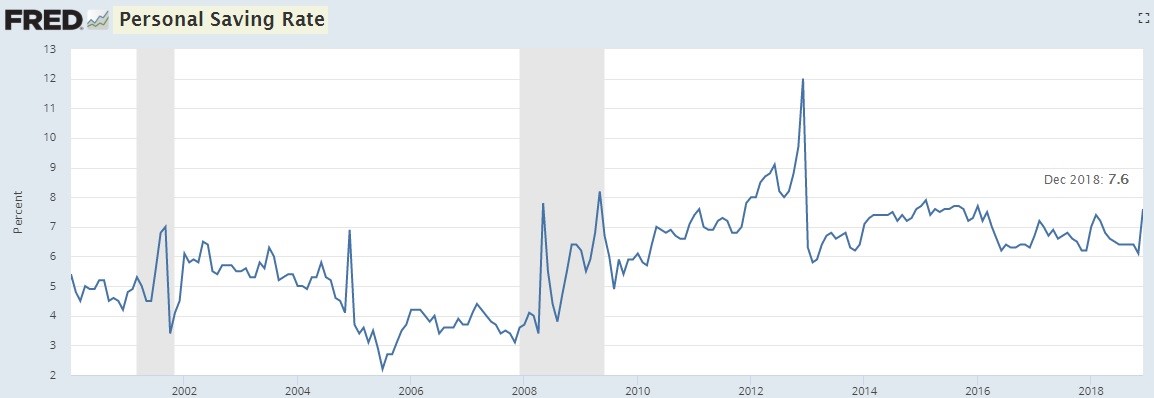
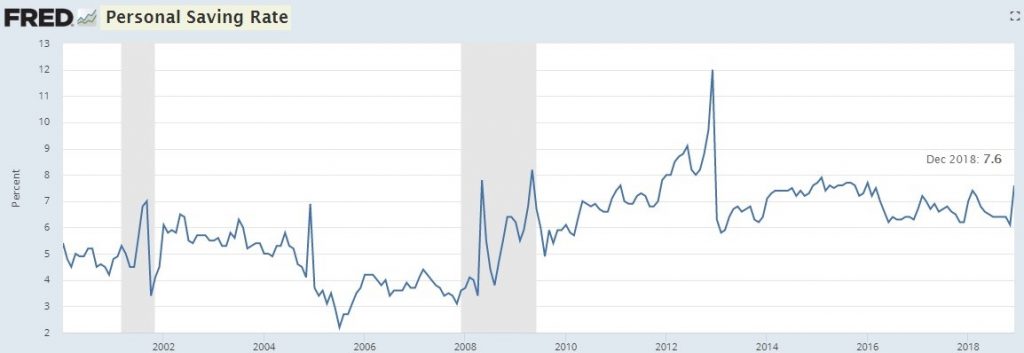
In December, monthly consumer spending growth was -0.5% which missed estimates for -0.3% and November’s 0.6% growth. Since personal incomes soared and spending fell, the personal savings rate exploded higher as you can see in the chart below. The savings rate increased from 6.1% to 7.6%. It’s unlikely that we will continue to see consumption slow if incomes continue to rise. This is the highest savings rate since January 2016 which was the last recession scare where there was a volatile stock market.
December headline and core PCE inflation were mostly consistent which is great for the Fed which has recently pledged to be patient with rate hikes. The Fed can’t avoid rate hikes if inflation is spiking. Headline inflation was 1.7% which fell from 1.8% and met estimates. Core inflation was 1.9% which met estimates and was the same as November. Core inflation is above headline inflation because of the decline in oil prices. Core PCE inflation spiked last March, so we expect it to fall this March. The 2 year core inflation stack increased from 3.53% to 3.58% in December.
Conclusion
The bears have left the market in droves. The Q4 GDP report was solid because of the spike in business investment growth and the solid consumption growth. If the housing market rebounds in 2019, it will be a solid year. However, economic growth looks to be starting the year out poorly as two Q1 Fed Nowcast estimates are below 1%. Inflation remained low which means the Fed can continue to avoid rate hikes. The savings rate spiked which reinforces the notion that the consumer isn’t overly leveraged.
Have comments? Join the conversation on Twitter.
Disclaimer: The content on this site is for general informational and entertainment purposes only and should not be construed as financial advice. You agree that any decision you make will be based upon an independent investigation by a certified professional. Please read full disclaimer and privacy policy before reading any of our content.


