UPFINA's Mission: The pursuit of truth in finance and economics to form an unbiased view of current events in order to understand human action, its causes and effects. Read about us and our mission here.
Reading Time: 4 minutes
We usually review the internal surveys like the ones from Bank of America to get an idea of where the official data will be. However, times have changed because of this quick shock to the system. Stocks aren’t trading off economic data; they are trading off the number of COVID-19 cases, the shutdowns, fiscal policy, monetary policy, and sentiment. We’ve seen many wild sentiment swings that have set up big reversals. That’s how you get stocks rallying on the weakest jobless claims report ever last week.
Now we highlight internal surveys and non-traditional reports because they give us a more updated information about the economy. This is all about finding out how bad it’s getting on Main Street to understand how difficult it will be for the economy to recover. We will never get a less relevant jobs report than the March jobs report which comes out this Friday.
Let’s look at the disastrous internal data from Bank of America. The table below shows the daily trend in spending growth across several industries.
There was a huge spike in groceries spending in the middle of the month as many people still had their previous paycheck and used it to stock up on the essentials to prepare for the shutdown. That explains why Redbook same store sales growth in the week of March 21st was 9.1%. The stock ups ended towards the end of the month as people actually used the items they bought, didn’t have as much money because they lost their jobs, and didn’t want to go outside as much. In the week of March 28th, Redbook same store sales growth fell to 6.3%. Specifically, at the peak the 1 week (yearly) growth rate in toilet tissue sales was 122.6%; it was 102.7% for food bags.
There has been such a crash in sales that airlines, lodging, and cruises have experienced several days where sales growth was below -100%. When growth is below -100%, it means there were refunds. What will growth rates be next year when comps are negative? Besides those 3, entertainment, restaurants, and clothing were in trouble. According to OpenTable, yearly bookings growth has been 0 since March 21st in America. The data from Bank of America is probably higher because of deliveries. Besides groceries, the only source of strength was online electronics. That’s because people are switching to working from home.
The Wealthy Are Pulling Back
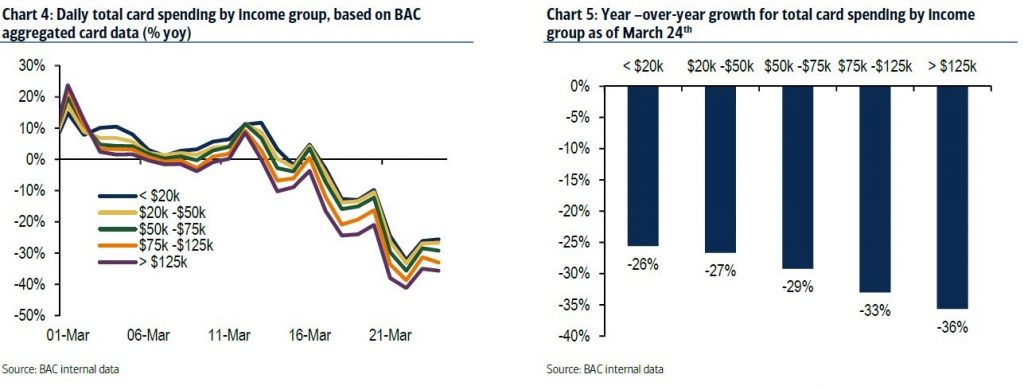
The wealthy pulled back on spending more than the poor, not because they are being hit harder than the poor. They are pulling back because they have more discretionary purchases. The poor and lower middle class spend much of their budgets on groceries which means the stocking up had a greater positive impact on their spending than it did for those that are more wealthy. As you can see from the chart below, the yearly growth rate in card spending as of March 24th was -36% for those making over $125,000 per year. Growth was -26% for those making less than $20,000; it was -27% for those making from $20,000 to $50,000.
New York Is In Big Trouble
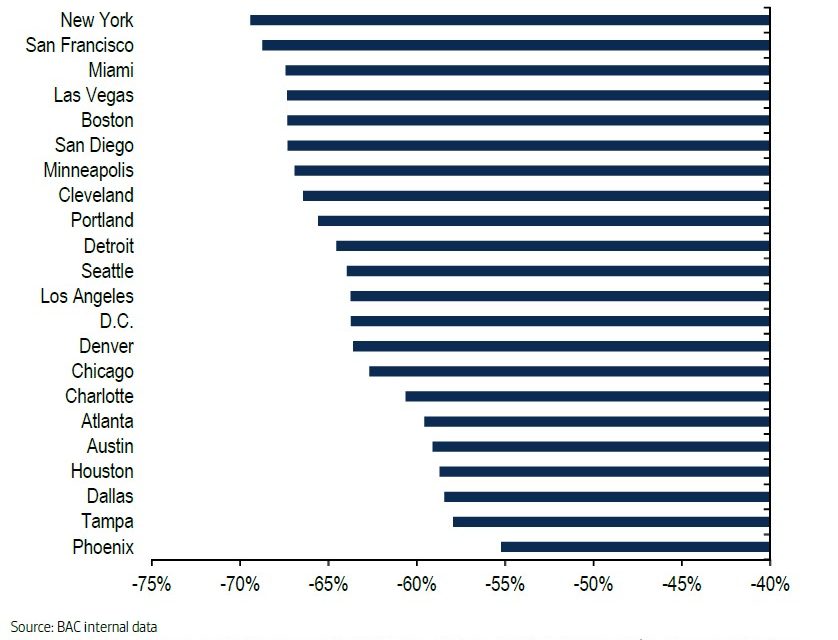
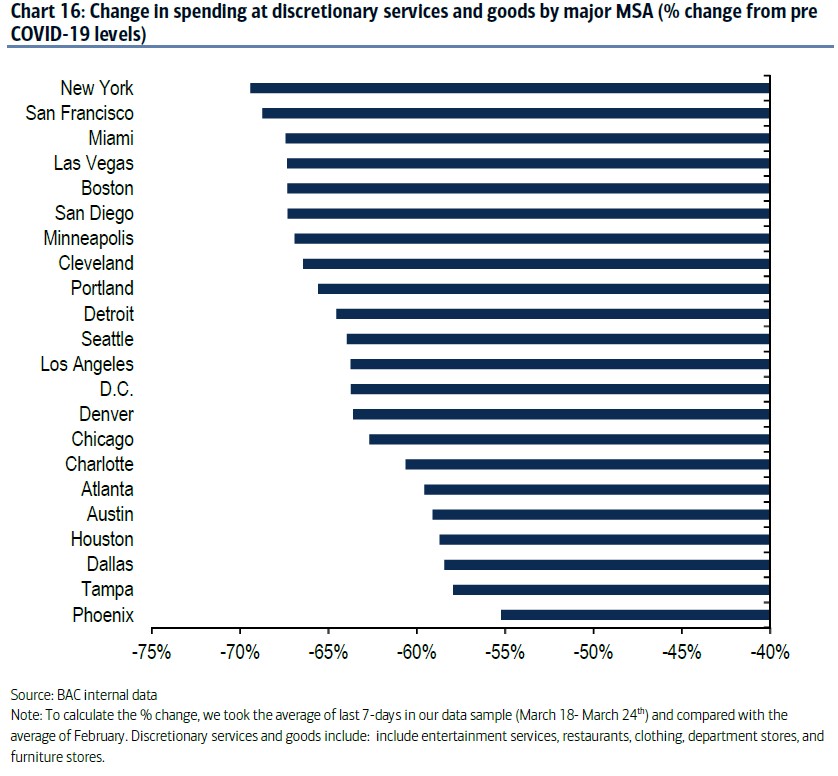
From March 18th to March 24th, New York had a nearly 70% decline in discretionary spending compared to February. The situation in NYC is slowly getting better as it was one of the first major hotspots. The number of new cases per day peaked on March 25th at 3,705. The number of new hospitalizations per day peaked on March 27th at 820. The number of deaths per day peaked on March 31st at 180. You can see the evidence of the shutdown in the data below. New York has been under a stay at home order since March 22nd which will last at least until April 15th. The next worry is there will be new hotspots after New York cools down. If there are, it will push back the national peak in the number of new cases per day.
Russell 2000 Below Book Value
Previously, we have discussed the near 2009 trough level S&P 400 small cap forward PE ratio. The chart below shows the same point that small caps are cheap. As you can see, it reviews the percentage of Russell 2000 stocks with price to book values below 1 and the percentage of stocks valued at under 3 times cash.
There are more stocks below their book value than the peak in the financial crisis. The percentage below 3 times cash is elevated, but lower than that peak. We think that bifurcation has occurred because energy companies are in deep trouble. These firms might be below their book value, but they don’t have much cash as many are going bankrupt. Also, just because something is cheap, doesn’t mean its good. Valuation isn’t a timing mechanism.
Weak March ISM Manufacturing
The ISM manufacturing PMI fell from 50.1 to 49.1 in March which beat estimates for 44. However, it was a terrible report that was “helped” by supplier delivery times. The delivery times index rose 7.7 points to 65. It’s not good news that firms couldn’t move product quickly because of the shutdown. The chart below shows excluding deliveries, the index was the weakest since the financial crisis. New orders fell 7.6 points to 42.2 which was the lowest since the last recession; the employment index fell 3.1 points to 43.8. The prices index fell 8.5 points to 37.4 which makes sense because the Bloomberg Commodities prices index recently fell to the lowest point since the mid-1970s. A machinery firm stated, “COVID-19 has caused a 30% reduction in productivity in our factory.”
Conclusion
Spending has been weak especially in discretionary industries such as travel. Spending growth has fallen the most for the upper middle class and those that are wealthy because they spend the most on discretionary items/services. New York has been the hardest hit, but there have been signs of COVID-19 improvement in the past few days. Russell 2000 companies are relatively cheap. Watch out for value traps and firms that have financing risk. The ISM manufacturing PMI missed estimates, but the report was very bad. It appears the services sector is being hit harder than manufacturing though (based on Markit flash PMI).
Have comments? Join the conversation on Twitter.
Disclaimer: The content on this site is for general informational and entertainment purposes only and should not be construed as financial advice. You agree that any decision you make will be based upon an independent investigation by a certified professional. Please read full disclaimer and privacy policy before reading any of our content.


