UPFINA's Mission: The pursuit of truth in finance and economics to form an unbiased view of current events in order to understand human action, its causes and effects. Read about us and our mission here.
Reading Time: 4 minutes
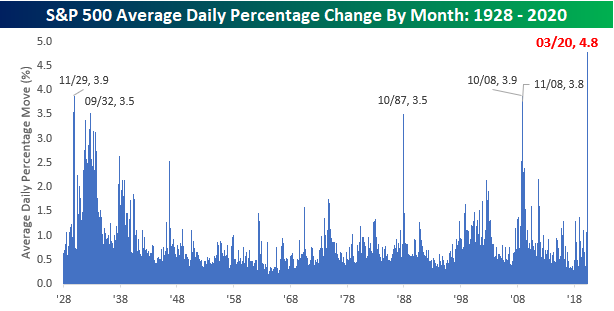
You just watched history if you followed markets in March. As you can see from the chart below, the average move in the S&P 500 was 4.8% each day. That’s larger than the previous joint record of 3.9% in November 1929 and October 2008.
Whenever there are large moves, you know stocks are falling. Stocks take the stairs up and the escalator down. This was the worst quarter for stocks since 1987. WTI oil fell 66% which was its largest quarterly drop ever. There was even a point where oil sold for negative prices in Wyoming. Its common to see oil that doesn’t have access to a lot of pipelines fall to the single digits. These areas underperforming WTI is similar to how the average stock underperforms the S&P 500 in bear markets.
Take a moment to visualize how the world will be at the end of April. By then we will know how the reopening of Wuhan went. We will know the details of most Q1 earnings reports. We will likely see if Italy is ready to reopen in May. Finally, we will know if the number of daily new cases in America peaked. Uncertainty will fall. Obviously, that’s not a guarantee stocks will rise because if those 4 uncertainties turn out badly, the odds of an elongated recession increase.
Terrible Labor Market
The jobless claims report last Thursday was terrible. It was the highest total by far even if you adjust for the size of the labor market. There are 2 reasons that occurred. First, the weakness was sharp as people lost their jobs simultaneously due to a shock to the system. Businesses were shuttered. That means the weakness that’s usually spread over time in recessions occurred at once. The 2nd reason is the obvious. This labor market is about to be in the worst shape since the Great Depression. Even if this recession occurred in normal speed, we’d see record claims because the unemployment rate is about to be the highest since the Great Depression. It will hit double digits in April.
Jobless claims are more valuable than the monthly labor report because claims are weekly. We won’t see sharp weakness in the monthly report until the first Friday of May. The March report this Friday is expected to show a 0.4% increase in the unemployment rate to 3.9%. It’s expected to show 150,000 in job losses. That’s historically important because this will end the record long streak of job creation.
As you can see from the chart below, our statements in previous articles that jobless claims will increase in the next report are reflected in the median estimate. Initial claims are expected to rise from 3.283 million to 3.5 million. The highest estimate on Wall Street is 6.5 million. Remember, these reports aren’t necessarily tradeable. Everyone knows the labor market is in dire shape. Stocks rose after the spike in claims last week.
The labor market is in terrible shape because of the sheer percentage of firms that are impacted by the shutdowns. As you can see from the pie chart on the right, over 40% of the labor market will be severely impacted by COVID-19. That’s why you hear predictions for exceedingly high unemployment.
St. Louis Fed President Bullard said there could be 47 million job losses and an unemployment rate of 32.1%. That would exceed the Great Depression peak of 24.9%. As you can see from the chart below, Oxford Economics agrees with our expectation for double digit unemployment. The firm sees the economy losing 20 million jobs and the unemployment rate spiking to 12% by April. It’s unlikely for there to not be double digit unemployment in April because we have potentially already seen 7 million job losses in 2 weeks.
This Is A Mental Health Crisis
COVID-19 has caused a mental health crisis. It’s tragic to see the deterioration in mental health in America and likely around the world. The fear of getting sick combined with job losses is bad for mental health. The chart below is from a survey of hourly service workers with a young child in a large U.S. city.
As you can see, the percentage of people who worked each day is correlated with the mental health index. The percentage of parents who felt anxious or depressed all day rose from 6% in the first month of the survey to 10% in the last week of it (it ended March 24th). That’s a 67% increase in severe mental health problems. The percentage of children experiencing externalized behavior (mental health issues) rose from 14% to 20%. The family mental health index fell by 2 standard deviations. In this survey only 45% of the people laid off applied for unemployment insurance. Government help isn’t coming quick enough.
Consumer Confidence Falls
The Conference Board Consumer confidence index isn’t a great measurement this time because its cutoff date is March 19th. Even so, it had a large decline in March. It would have been much worse if it included data a week later. As you can see from the chart below, it fell from 132.6 to 120. That actually beat estimates by 10 points. It was still its largest drop since August 2011. The index has fallen 12.6 points or more 16 times since 1967. In quarters where confidence fell that much, GDP fell 0.6% (other quarters up 2.9%).
The present situation index fell from 169.3 to 167.7 and the expectations index fell from 108.1 to 88.2. Let’s look closely at the expectations index. The percentage expecting business conditions to improve fell from 20.6% to 18.2%; the percentage expecting business conditions to worsen increased from 7.2% to 14.9%. The net expecting better conditions fell from 14.4% to 3.2%. Those expecting more jobs in the next 6 months fell from 16.6% to 15.5% and the percentage expecting fewer jobs rose from 12% to 17.1%. The net percentage expecting more jobs fell from 4.6% to -1.6%.
Conclusion
March was an extremely volatile month as COVID-19 ran rampant throughout the world, especially in Europe and America. The good news is the betting market shows the odds of there being 1 million cases by April 15th in America have fallen to 40% (from 74% on March 28th). The labor market is in the worst shape since the Great Depression as double digit unemployment is a given. This has led to a major decline in mental wellness. The Conference Board consumer confidence index fell, but it would have been worse had the last 12 days of the month been included.
Have comments? Join the conversation on Twitter.
Disclaimer: The content on this site is for general informational and entertainment purposes only and should not be construed as financial advice. You agree that any decision you make will be based upon an independent investigation by a certified professional. Please read full disclaimer and privacy policy before reading any of our content.


