UPFINA's Mission: The pursuit of truth in finance and economics to form an unbiased view of current events in order to understand human action, its causes and effects. Read about us and our mission here.
Reading Time: 5 minutes
In September, the treasury surplus was $82.8 billion which missed estimates for $106 billion. The deficit was $200.3 billion in August. There is usually a surplus in September as it was $119.1 billion last year. The fiscal year 2019 deficit was $984.4 billion which is 26.4% larger than last year. That’s terrible when you consider that the labor market got fuller. With the unemployment rate the lowest since December 1969, the treasury budget should be in great shape, but it isn’t.
Extremely High Fiscal Deficit
The chart below measures the deficit cyclically. Because the deficit is so large this late in the cycle, the current deficit blows away any previous cyclically adjusted deficit since at least 1960.
Spending has massively expanded this expansion. In theory, there should be a cyclically high percentage of people and businesses paying taxes and a cyclically low percentage of people taking money from the system because they don’t have a job or are in poverty. Total fiscal year receipts were up 4.2% from last year, but outlays were up 8.2%. Individual income tax receipts were up 2% to $1.718 trillion and corporate tax receipts were up 12.3% to $230.2 billion. Defense spending was up 8.8% to $687.6 billion and veterans benefits were up 11.8% to $200 billion. Interest costs on the debt were up $15.7 billion to $375.6 billion. That’s with near record low interest rates.
Imagine how bad the deficit would be with higher rates. We don’t know at what point the deficit becomes an issue, but higher rates would certainly blow a hole in America’s balance sheet. The Democratic candidates are running on spending more money domestically as they are calling for student loans to be eliminated and Medicare for all. Look for the deficit to go up in the next few years no matter which party wins even if the economy avoids a recession.
Good New Home Sales Report
We’ve recently seen some subpar housing reports which was slightly disconcerting given the momentum housing appeared to have and how low rates are. Consumers are extremely confident in their expected real income growth and rates are near their record low. That’s a great combination for the housing market. Specifically, the August new home sales reading was revised from 713,000 to 706,000. The June reading is still the cycle high. Cycle highs in new home sales have historically meant a recession isn’t coming soon. In September, new home sales were 701,000 which beat estimates by 3,000. The 3 month average fell from 700,000 to 691,000. Those are the highest 3 month average and the 2nd highest average of this cycle.
Unlike the existing home sales report which showed median prices increased 5.9% yearly to $272,100, median new home prices fell sharply. Monthly prices fell 7.9% to $299,400. Yearly price growth was -8.8%. That tightened the price gap between new and existing home prices as the difference is now $27,300. As you can see from the top chart below, the decline in prices was driven by a huge swing away from homes costing $400,000 to $499,999.
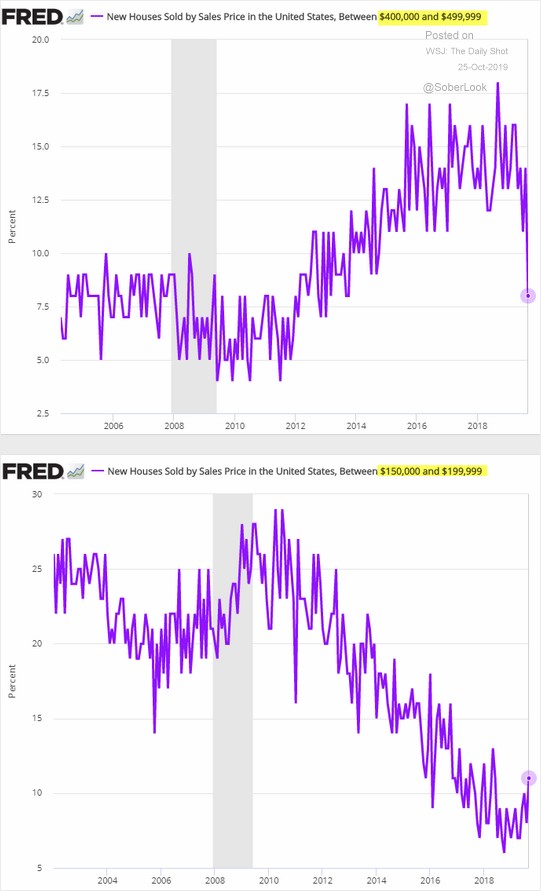
There was an increased share in houses costing from $150,000 to $199,000. This decline in prices drove the 15.5% yearly growth in new home sales. Supply stayed at 5.5 months. Remember, supply was 4.1 months for existing homes. Both inventory levels can increase slightly because of supply without it being problematic.
Now let’s look at the new home sales report from a long term perspective. As you can see from the chart below, even though new home sales are at a cycle high, on a population adjusted basis, they have been below the long term range for this entire cycle.
There is still room for more new homes to be built and the home ownership rate to increase. The problem is affordability. Even with the full labor market generating positive real wage growth and interest rates being near their record low, many millennials are having a difficult time affording housing. If the labor cycle ends soon, new home sales won’t get to the low end of the historical range for another few years. We might need to see home prices fall to get there.
Final October Consumer Confidence Reading
The final October University of Michigan consumer confidence index fell to 95.5 from 96 in the initial reading. That’s still above its reading of 93.2 in September. The current economic conditions index rose from 108.5 to 113.2 and the consumer expectations index rose from 83.4 to 84.2. Tariffs were mentioned negatively by 27% of respondents which is a 9% sequential decline.
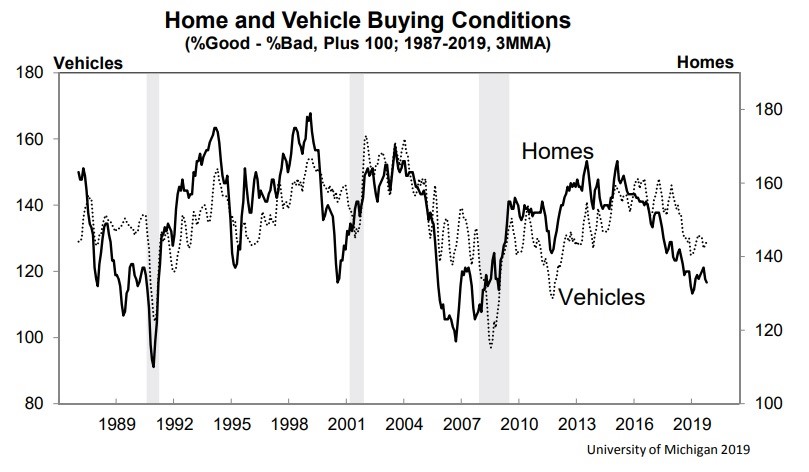
The story of this report is about home and vehicle buying conditions.
Early in this cycle buying conditions were great, but the labor market was weak, making it tough for many to buy homes. In 2018, the labor market was stronger than early in the cycle, but housing was considered too expensive as buying conditions fell. Buying conditions were hurt by high prices and relatively high rates later in the year. It’s doubtful we’d ever see buying conditions improve and prices fall significantly if the labor market stayed strong. We’re currently seeing a modest rebound in housing because of the strong labor market and low rates.
Bloomberg Consumer Confidence
In the past few months, the Bloomberg Consumer Comfort index has been showing the most optimism out of the three major consumer confidence reports (Conference Board & University of Michigan). In the week of October 13th, the index rose 0.8 to 63.5. That’s just 1.2 points from the July peak which was an 18 year high. Comfort among full-time workers hit an all-time high as the labor market is proving solid real wage growth partially because of the decline in inflation. Sentiment among people in households where the income is $100,000 or more was the best since 2004 when the data started being calculated. Consumer expectations fell 0.5 to 49. As you can see from the chart below, the buying climate rose to a record high reading of 58. That’s great for retailers ahead of the holiday shopping season.
Conclusion
The fiscal deficit is absurdly high when you adjust for the business cycle. The new home sales report was solid. There was a big decline in homes sold between the price of $400,000 and $499,999. This lowered the median price of new houses sold sharply. Population adjusted new houses sold isn’t even at the low end of the historical range. The University of Michigan consumer sentiment index improved in October. Buying conditions for vehicles and houses are weak. The Bloomberg Consumer Comfort index was very strong and the buying climate index hit a record high.
Have comments? Join the conversation on Twitter.
Disclaimer: The content on this site is for general informational and entertainment purposes only and should not be construed as financial advice. You agree that any decision you make will be based upon an independent investigation by a certified professional. Please read full disclaimer and privacy policy before reading any of our content.


