UPFINA's Mission: The pursuit of truth in finance and economics to form an unbiased view of current events in order to understand human action, its causes and effects. Read about us and our mission here.
Reading Time: 4 minutes
Barron’s does a survey of money managers each spring and fall. The results from the poll in late September in which 134 money managers participated were surprisingly bearish. This is in line with how individual investors expressed themselves in the AAII poll earlier this fall. The latest AAII results are a bit more optimistic, but still less bearish than average. Uncertainties on trade, politics, earnings, monetary policy, and the economy probably played a role in fund managers’ bearishness. Even though we’ve gotten some clarity on trade and earnings in the past couple of weeks, it’s not as if it’s obvious where the economy is headed in 2020 and who the Democratic presidential nominee will be.
According to the survey 31% of money managers were bearish and only 27% were bullish. At previous bottoms, managers were much more bullish. At the bottoms in 2002, 2008, and 2016, 43%, 59%, and 38% were bullish. Those investors were obviously correct. Clearly, stocks aren’t at a bottom now because they haven’t fallen. We’re just giving context. Besides at bottoms, very few stated (less than 10%) stocks were overvalued in the fall of 2014 which was the end of the mini-expansion and many stated stocks were overvalued (above 40%) in the spring of 2017 which was the beginning stages of a great run for stocks. Yes, stocks topped in January 2018, but a lower percentage said they were overvalued in the fall of 2017 and the spring of 2018. The data at bottoms looks good, but it’s at best a mixed bag based on the valuation analysis expressed in the chart above.
Money managers aren’t buying this market. They think it has no upside. By the end of the year, according to the survey, the S&P 500 is expected to be at 2,943; by mid 2020, it’s expected to be at 2,953. As of Monday’s close, the S&P 500 was at 3,039. That’s an implied decline of 3.2% by the end of the year and a decline of 2.8% by the middle of next year. It’s common to see the goalpost moved after big changes in stocks. People don’t want to be caught with a non-consensus position or an opinion that’s too one sided. We will hold them to those projections and say they see modest declines in the intermediate term. That’s not exactly calling for the next bear market, but it’s not optimistic.
We’ve seen many projections calling for very low long term returns in U.S. stocks based at least partially on the Shiller PE or the fact that this has been a long expansion. At a certain point, these projections need to be proven wrong even if they are for the long run. If you were bearish because of the Shiller PE and the length of the cycle in 2016, you were wrong.
Economic Projections
It’s no surprise, given the pessimism expressed on stocks, that managers aren’t bullish on the economy either. 39% state real US GDP growth will be 1.5% or less. Just 15% state growth will be 2.5% or higher. 26% expect 2% growth, which is slightly above the Fed’s projection for the long run average. 39% state there will be a recession by the end of 2020. 33% say there will be one in 2021. It’s common for people to predict a recession in about 2-3 years and then move the goalpost further when it doesn’t happen. Recession calls are getting more aggressive because the economy is weak and this expansion is very old. Only 15% see the 10 year yield at 2.5% in one year. If nominal growth recovers, the 10 year yield can get there.
Since Q3 GDP growth is about to be released, let’s look at Oxford Economics’ projections. The firm sees real consumer spending growth of 2.3%. It sees business investment growth declining 1.6%. That would be the 2nd straight decline. Residential investment growth is expected to be positive for the first time in 6 quarters. Net trade and inventories are expected to drag growth by 0.7%. As you can see from the chart below, the firm sees 1.2% quarter over quarter annualized growth and 1.9% yearly growth. This slowdown is nearly as bad as the one in 2019.
Chicago Fed National Activity Index
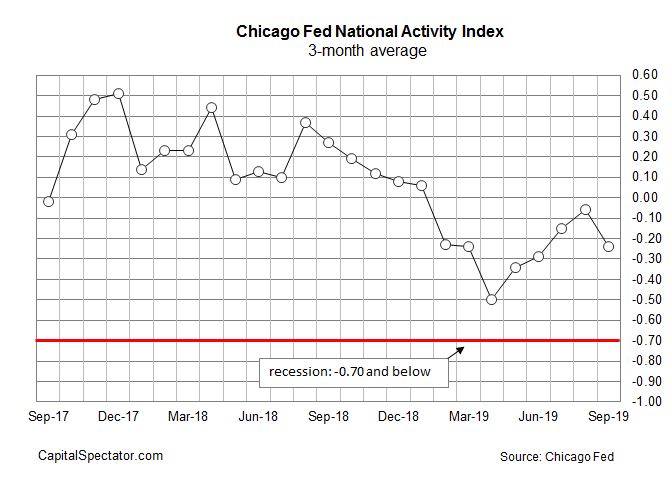
The September Chicago Fed national activity index fell and brought down the 3 month average. However, the economy might not be as weak as it seems because the GM labor strike was a big reason for the decline. The GM labor strike ended in late October, so the index might recover in November. Specifically, the index fell from 0.15 to -0.45. The 3 month average fell from -0.06 to -0.24. As you can see from the chart below, this isn’t the low for the year and it’s not close to the recession line which is -0.7.
The September reading was the weakest since April. It was brought down 0.4 by production related indicators which include the sharp decline in vehicle production related to the GM strike. The other categories were all slightly negative.
Why Stocks Are At A Record
The S&P 500 is at its record high because earnings season has been good. This is despite the expected weak GDP growth in Q3 and potentially in Q4. As you can see from the table below, Q4 EPS estimates have fallen 1.84% after 199 firms have reported results. They fell 2% last quarter.
The trend of smaller estimate declines has been ongoing for three straight quarters now. It’s still worse than the 3 year average, but that average is manipulated higher by Q1 and Q2 2018 which were unusual quarters impacted by the tax cut.
Conclusion
More money managers are bearish than bullish. 39% even see a recession starting in the next 14 months. They’re probably negative because of the weak Q3. The reality is stocks don’t trade on the Q3 2019 economy. They are trading on future growth. Investors look at the lower decline in earnings estimates and buy stocks. Keep in mind that if it wasn’t for the GM strike, the Chicago Fed index would be close to 0. There is little recession risk. Growth might even rebound in 2020 unlike what fund managers are predicting.
Have comments? Join the conversation on Twitter.
Disclaimer: The content on this site is for general informational and entertainment purposes only and should not be construed as financial advice. You agree that any decision you make will be based upon an independent investigation by a certified professional. Please read full disclaimer and privacy policy before reading any of our content.


