UPFINA's Mission: The pursuit of truth in finance and economics to form an unbiased view of current events in order to understand human action, its causes and effects. Read about us and our mission here.
Reading Time: 4 minutes
The Fed is going to cut rates for the third straight time on October 30th. What makes this cut unique compared to the prior two is that the Fed should be done with cuts for the intermediate term. There is only a 24.9% chance of a cut in December and that’s with the median Q3 GDP growth rate at 1.6%. The market knows Q3 wasn’t great and it still isn’t pricing in another cut. This is a market which has been aggressively pricing in cuts all year.
Even if you go to April 2020, there is only a 56.8% of at least one more cut. Of course, this all is subject to change. We will get our first understanding of whether it will change after the Fed’s statement comes out and Powell does his press conference. The Fed hasn’t been at the forefront of forecasting cuts this year. It has begrudgingly followed the market. In that case, maybe what the Fed says isn’t a big deal. We will certainly be watching how the Fed funds futures market reacts to whatever it says or does.
It’s clear the economy was peaking in 2018, yet the Fed was raising rates. Last fall, there were expectations for multiple hikes in 2019, which is laughable as growth has slowed. This potential policy mistake partially explains the 20% decline in the S&P 500 in Q4 2018. As you can see from the chart below, the Fed has been running on a 10 month lag to economic data.
Specifically, the orange line shows consumer confidence, inflation, industrial production, and housing data. The Fed is very dovish now as it’s about to cut rates for the third time. However, the data summarized in the orange line appears to have bottomed about 8 months ago. It’s obviously debatable if the economy bottomed since Q4 GDP growth isn’t expected to strong based on the latest soft data.
Weak Durable Goods Orders
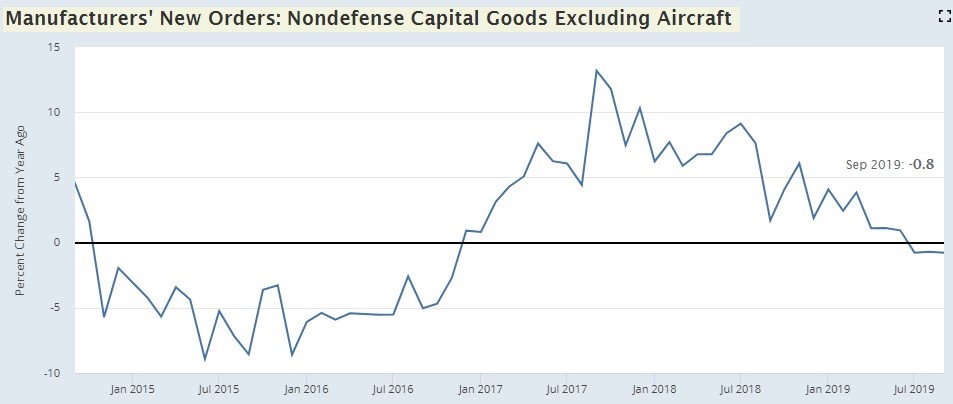
The September durable goods orders report was very weak. On a monthly basis, new orders growth was -1.1% which missed estimates for -0.7% and fell from 0.3%. The chart below beautifully shows the cycle as it is the 12 month rolling average of the 12 month cumulative change in orders.
Excluding transportation, durable goods orders fell 0.3% monthly which missed estimates for a 0.1% decline. Transportation was clearly as issue as this decline and miss were lower than the overall miss. Core capital goods orders fell 0.5% monthly which missed estimates for -0.2%. Making matters worse, August’s growth rate was revised from -0.2% to -0.6%.
Commercial aircraft orders fell 11.8% because of the grounding of the 737 Max. The GM strike caused motor vehicle orders to fall 1.6% and related shipments to fall 1.5%. Monthly fabrications and computers orders fell 1.5% and 0.9%. Machinery orders were up 0.2%. Shipments for core capital goods fell 0.7%.
Non-defense capital goods orders growth excluding aircrafts fell sharply last September, but growth didn’t improve with that easier comparison. The 2 year growth stack fell from 6.91% to 0.93%. That’s a huge negative swing that’s masked if you just look at the yearly growth rate which went from -71 to -78 basis points. The comp gets tougher in the next 2 months which is bad news for future yearly growth. In the last cycle, growth troughed at -8.6% in December 2015. Growth could fall further in November as the comp is 6.1%. For overall durable goods, order growth fell from -2.85% to -5.35%. The 2 year growth stack fell from 10.13% to 2.45%.
Markit Flash Composite Hits 3 Month High
The recent Markit PMIs had been part of the streak of the weak soft data reports. This changed somewhat with the October Markit report. The composite flash PMI increase from 51 to 51.2 which is a 3 month high. The improvement was mainly because of manufacturing. Specifically, the manufacturing PMI rose from 51.1 to 51.5 which is a 6 month high. That’s way above the September ISM PMI of 47.8. The manufacturing output PMI increased from 51.8 to 52.7 which is also a 6 month high. The service sector PMI only increased 0.1 to 51 which is a 3 month high.
Even though the composite PMI increased, new work growth was its lowest ever (since October 2009). On the other hand, manufacturers had the quickest increase in new business volumes since April. This means new work was weak in services. Overall, backlogs fell for the 3rd month straight as new work barely grew. Employment fell for the 2nd straight month.
As you can see from the chart above, the employment index was the weakest since December 2009. It’s consistent with only about 50,000 jobs added which is below the amount necessary to keep up with population growth (slightly above 100,000). Surprisingly, optimism increased to the highest level in 4 months because of hopes about improved domestic conditions. This Markit report is consistent with 1.5% GDP growth which is in line with the median estimate for Q3 (October is in Q4).
Jobless Claims Low Again
In the week of October 19th, jobless claims fell 4,000 to 212,000 which was below estimates for 214,000. The 4 week moving average fell from 215,750 to 215,000. Jobless claims once again signal there is no cause for concern about a recession. Claims is one of the metrics in the current activity indicator which is consistent with 2.25% GDP growth. This claims report measures the 3rd week of the month which means it’s the survey week for the BLS report. The decline in claims might mean the BLS report will be good. As you can see from the chart below, heading into this report the 4 week average hadn’t had a yearly decline in 8 straight weeks. That was the longest streak since the last recession. This means jobless claims are stabilizing.
Conclusion
The Fed is about to cut rates again on Wednesday. We’ll be looking to see how this decision and subsequent statement and press conference impact the Fed funds futures market. As of now, it looks like the Fed’s streak of consecutive rate cuts will end at three. The durable goods orders report was terrible especially if you look at the decline in the 2 year growth stack. Somehow the Markit report showed improvement, but new work and employment both were terrible. The 4 week average of jobless claims had a yearly increase for 8 straight weeks because claims are stabilizing.
Have comments? Join the conversation on Twitter.
Disclaimer: The content on this site is for general informational and entertainment purposes only and should not be construed as financial advice. You agree that any decision you make will be based upon an independent investigation by a certified professional. Please read full disclaimer and privacy policy before reading any of our content.


